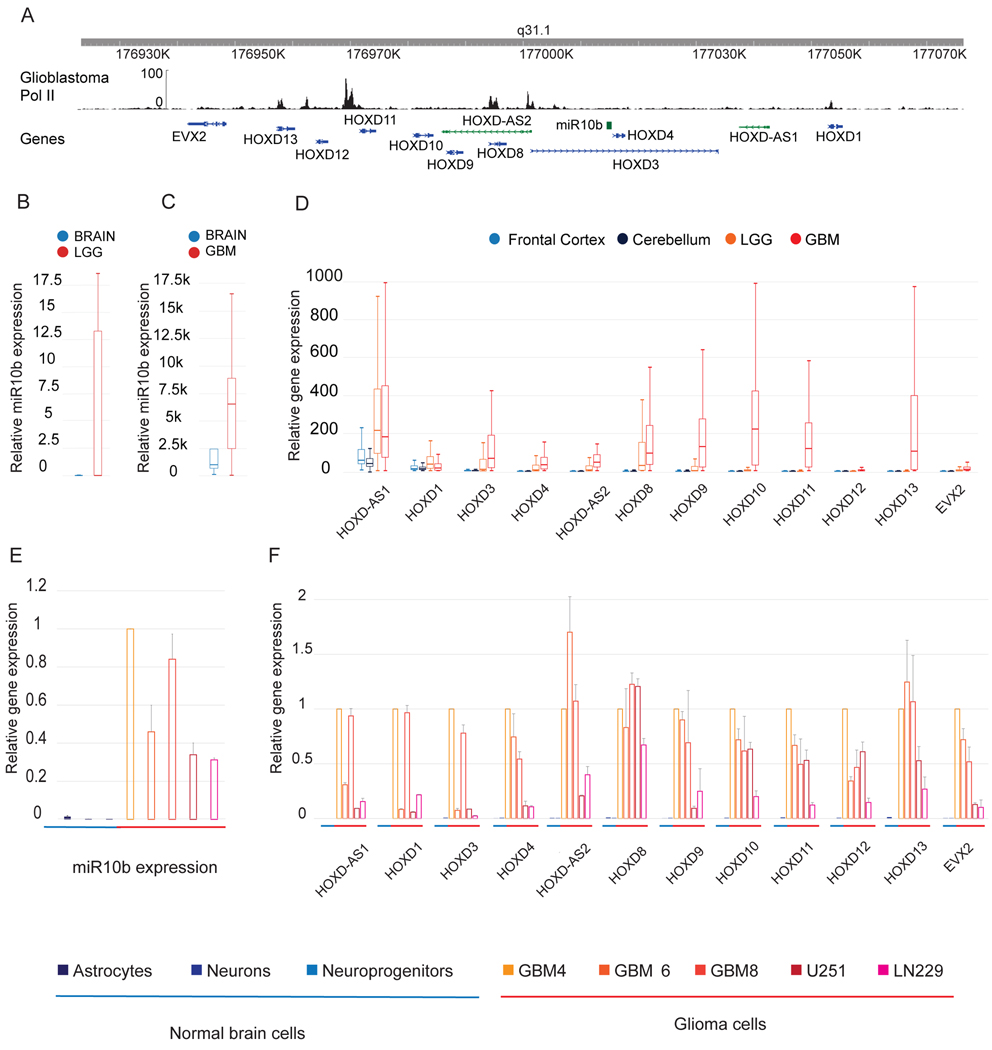
Figure 1. Gene expression in the HOXD/miR-10b locus is repressed in the human brain and activated in glioma cells and tumors.
A. Pol II ChIP-seq in HOXD locus, based on GBM track from ENCODE database (GSM808768). Gencode V19 was used for gene annotation.
B. Relative miR-10b expression in the brain and LGG. Illumina HiSeq data for the normal brain (n=5) and LGG (n=500) were retrieved from TCGA and visualized as boxplots. Unit: log2 (FPKM-UQ+1).
C. Relative miR-10b expression in the brain and GBM. Boxplot visualization of Illumina Human v2 MicroRNA expression BeadChip dataset (GEO number: GSE25632) for the normal brain (n=5) and GBM (n=103).
D. Expression of HOXD genes in human brain cortex, cerebellum, LGG, and GBM. TCGA TARGET GTEx dataset for cortex (n=300), cerebellum (n=300), LGG (n=500), and GBM (n=170) was visualized as boxplots. Unit: RSEM norm_count+1.
E. Relative miR-10b expression in normal neural cells, GSCs, and glioma lines was monitored by qRT-PCR. Each group included 3 biological replicates (mean+SD).
F. Relative expression of HOXD genes in normal neural and glioma cells was monitored by qRT-PCR (mean+SD, n=3).

