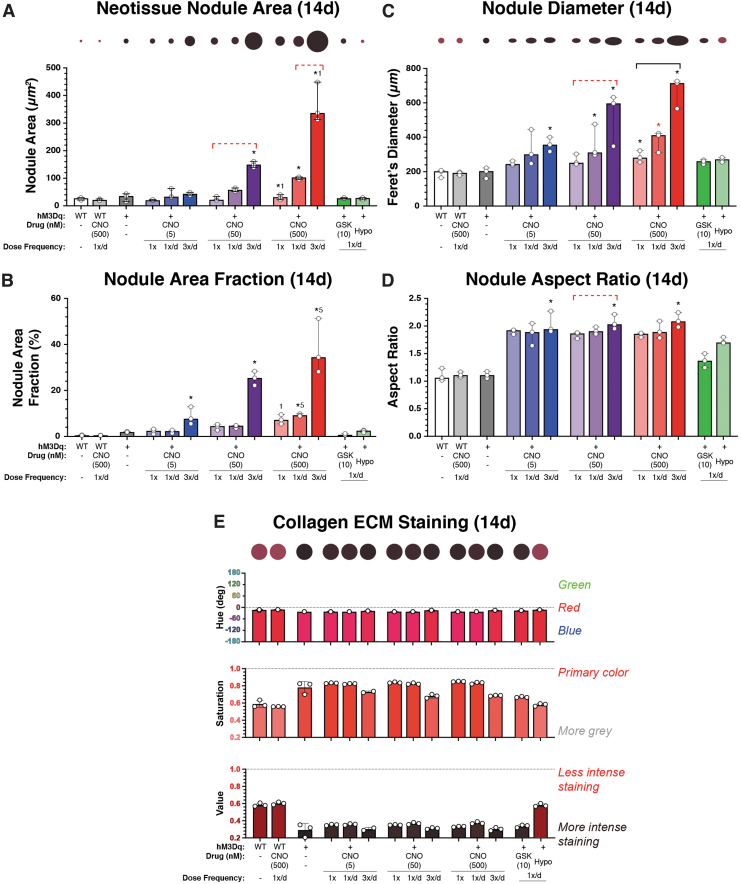
FIG. 5.
Analysis of neotissue nodule geometries and shape descriptors and collagen staining intensity after long-term stimulatory culture (14 days). (A) Average nodule size increased in a CNO dose- and frequency-dependent manner, from ∼20,000 μm2 in the least stimulated group to ∼120,000 μm2 and ∼320,000 μm2 in the thrice-daily 50 and 500 nM CNO-stimulated groups, respectively (p < 0.001). GSK101 and hypo-osmotic shock (HS) areas were indistinguishable from those of WT and unstimulated hM3Dq cultures. Circles having sizes scaled to total nodule areas are provided above the figure for visual reference. (B) The area fraction of nodules increased with CNO concentration and frequency; from ∼4–7% in the 1 × /week groups to ∼10% in the 5 nM CNO group and ∼24–38% in the 50 and 500 nM groups, respectively, when stimulated with CNO thrice daily (p < 0.001). Area fractions for GSK101 and HS-stimulated cultures were indistinguishable from those of WT/unstimulated cultures. (C) Similar CNO dose and frequency-dependent increases in the Feret's diameter of formed nodules (i.e., maximal geometric width) were observed. Circles having diameters and aspect ratios scaled to demonstrate treatment-dependent changes in nodule size and shapes are provided above the figure for visual reference. (D) Analyzing the aspect ratio of formed neotissue nodules demonstrated increasing elongation with increasing CNO dose and stimulation frequency. (E) Changes in collagen staining, that is, PR stain color, brilliance (gray content), and intensity, were assayed via measures of hue, saturation, and value, respectively. With increasing CNO concentration and dose-frequency, the stained collagen-rich tissues exhibited deeper (∼0.7–0.8) and darker (∼0.2–0.4) blue-red (∼350°) colors, indicative of increased collagen deposition. In (E), as well as (A, C), the colors of the indicated circles have been matched to the average HSV values of the group. *p < 0.05 compared with WT (& WT+CNO), bar = p < 0.05 for the comparison between indicated groups for the noted CNO concentration, 1p < 0.05 compared with once-only activation at the noted CNO concentration, and 5p < 0.05 compared with the 5 nM CNO activation for the same administration frequency; Kruskal–Wallis test with Dunn's multiple-correction tests. Statistical comparisons indicated in red are those that fell just short of significance, p < 0.1.

