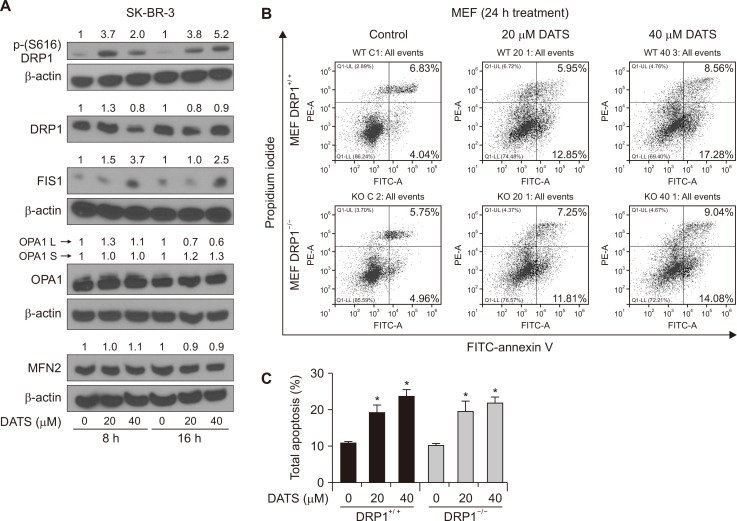
Figure 5. DATS treatment increased phosphorylation of DRP1 in the SK-BR-3 human breast cancer cell line.
(A) Western blotting for total DRP1, phospho-(S616)DRP1, OPA1, FIS1, MFN2, and β-Actin in SK-BR-3 cells after 8- or 16 hours of treatment with DMSO (control) or the indicated doses of DATS. Numbers on top of the immunoreactive bands represent changes in protein levels relative to corresponding DMSO-treated control. Results were comparable in replicate experiments. (B) Representative flow histograms depicting apoptotic fraction in DRP1+/+ and DRP1–/– MEFs after 24 hours of treatment with DMSO (control) or specified doses of DATS. (C) Percentage of total apoptotic fraction (early + late apoptotic cells) (mean ± SD; n = 3). Significant (*P < 0.05) compared with respective DMSO-treated control by one-way ANOVA followed by Bonferroni’s multiple comparisons. Experiments were repeated with comparable results. DRP1, dynamin-1-like; OPA1, optic atrophy protein 1; F1S1, fission, mitochondrial 1; FITC, fluorescein isothiocyanate; MFN2, mitofusin 2; MEFs, mouse embryonic fibroblasts; DATS, diallyl trisulfide; DMSO, dimethyl sulfoxide.

