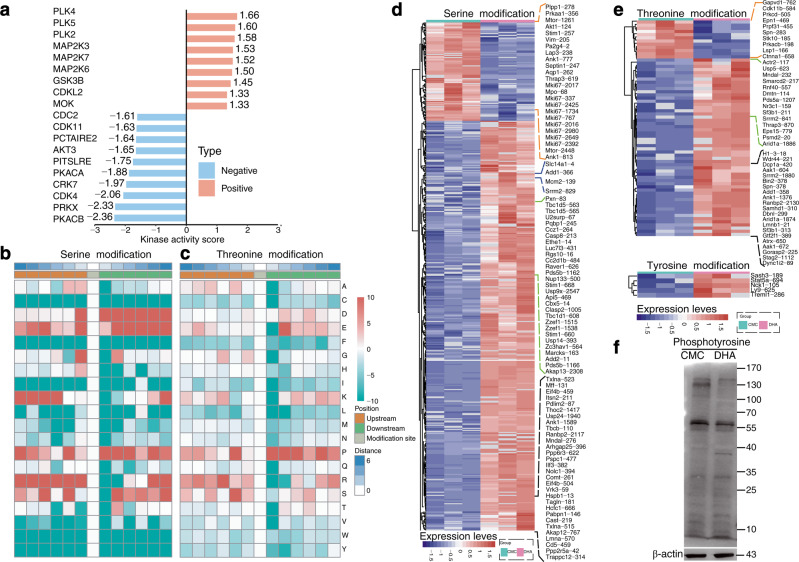
Fig. 4.
DHA-induced phosphorylation of MAPKs. a Analysis of the kinase activity between DHA to CMC group, where red indicates no inhibition (high kinase activity), blue indicates kinase inhibition (low kinase activity). b, c The motif enrichment heatmap of up-stream and down-stream amino acids of all identified modification sites. Red indicates that the amino acid is significantly enriched near the modification site and green significantly reduced near the modification site. d, e Heatmaps for visualizing are composed of the significant differentially modified sites between DHA and CMC group. f Western blot probed with a monoclonal anti-phosphotyrosine antibody to reveal the differences in protein phosphorylation between DHA-treated and untreated samples. DHA=dihydroartemisinin group, CMC=CMC (carboxymethyl cellulose) solvent solution control group

