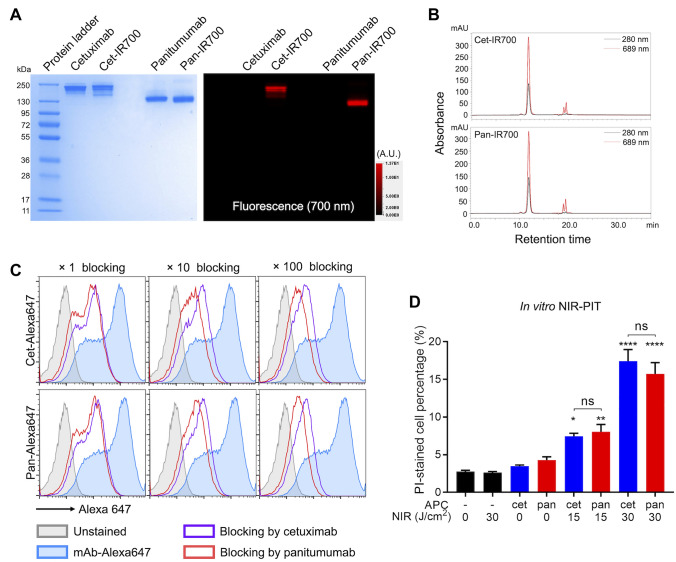
Fig. 1.
In vitro NIR-PIT A, Both APCs were assessed with SDS-PAGE. Left, Colloidal blue; right, 700-nm fluorescence. A.U., arbitrary unit. B, The APCs were assessed with SEC. Absorbances of 280 and 689 nm were measured. C. Flow cytometry analysis of the antibody affinity to the mEERL-hEGFR cells. Alexa 647-conjugated antibody was incubated with the cells. The fluorescence signals were blocked with either unconjugated antibody of 1, 10, or 100 molar excess. D, Quantitative cell viability assay after each therapy. The dead cell percentage was assessed with propidium iodide (PI) staining by flow cytometry (n = 4; one-way ANOVA followed by Tukey’s test; *, p < 0.05; **, p < 0.01; ****, p < 0.0001 vs. untreated samples; ns, not significant between two groups)

