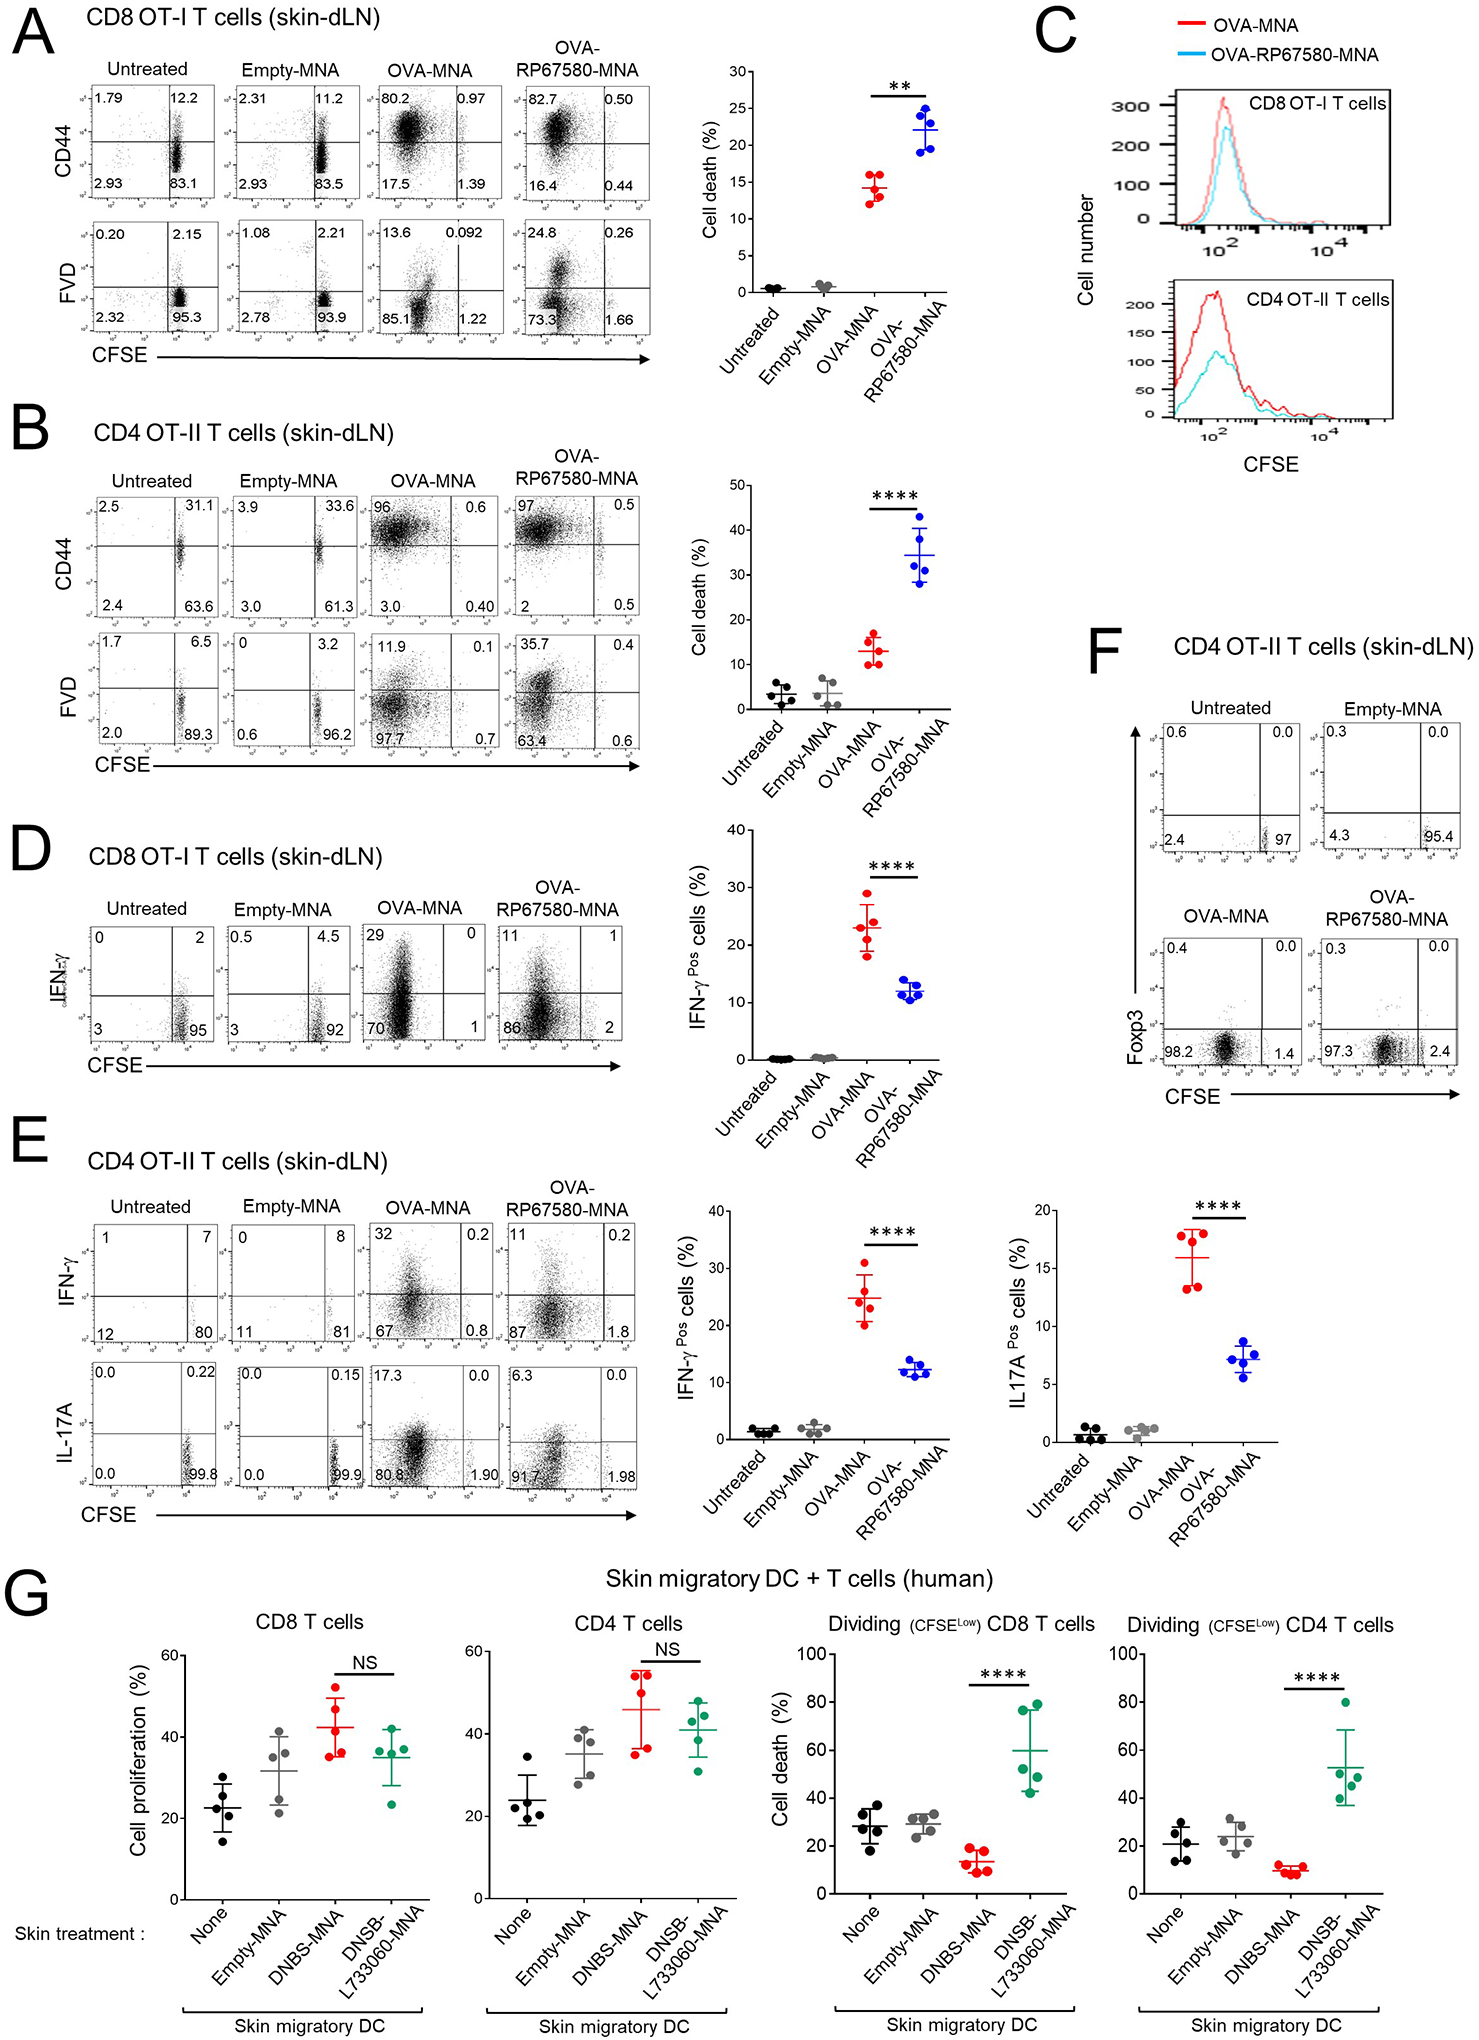
Fig 7. Co-administration of NK1R antagonists and Ag impairs mouse CHS to OVA and decreases the T cell-stimulatory function of human skin DC.

A and B) Cell death in proliferating CD8 OT-I (A) or OT-II cells (B) in skin-dLN of mice sensitized with MNAs. C) Side-by-side comparison of the proliferation of CD8 OT-I and CD4 OT-II cells shown in (A) and (B). D) Content of IFN-γ in the CD8 OT-I cells shown in (A). E) Content of IFN-γ and IL-17 in the CD4 OT-II cells shown in (B). F) Percentages of Treg in CD4 OT-II cells of the mice in (B). G) Proliferation and cell death of human CD4 and CD8 T cells stimulated with allogeneic DCs migrated from human skin treated with MNA. In the dot diagrams on the right of (A), (B), (D) and (E), one experiment of 3. In dot plots of (A), (B), (D), (E) and (F), numbers are percentages of cells per quadrant. In (G), each dot is a sample of responding T cells from a different mixed leukocyte culture. In (A), (B), (D), (E) and (G), means ± 1 SD were analyzed by 1-way ANOVA followed by Student-Newman-Keuls test. **p < 0.01, ****p< 0.0001.
