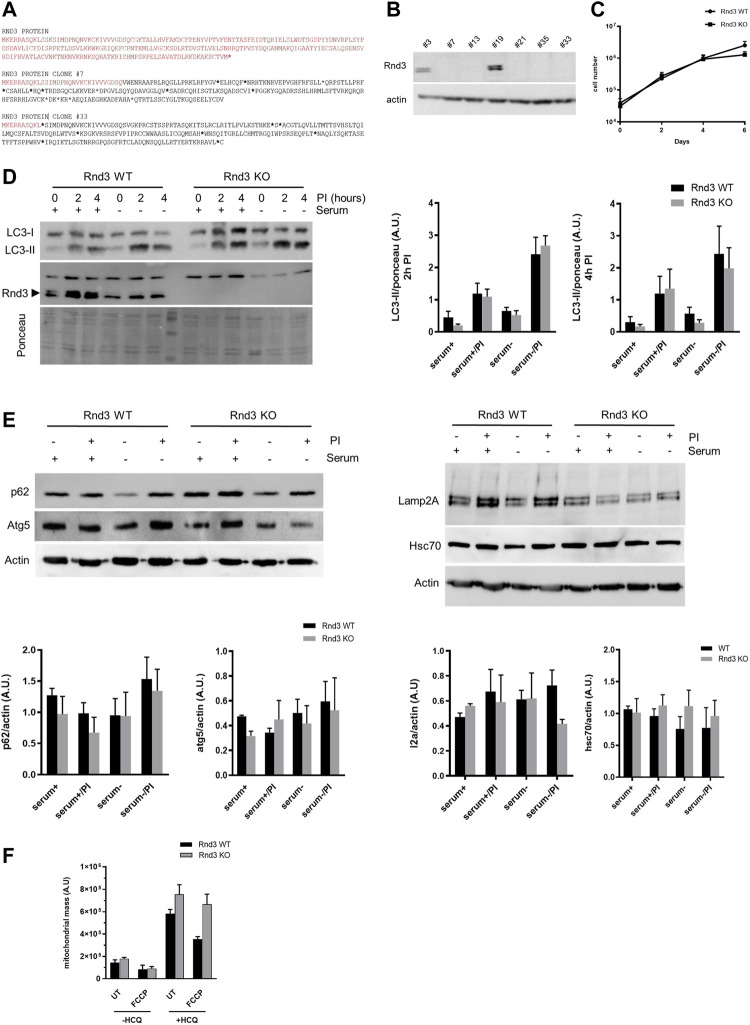
FIGURE 2.
Autophagy and mitophagy are not altered in cells lacking Rnd3 expression. (A) Representative aminoacidic sequences from CRISPR Rnd3 edited cells obtained by single cell cloning (clones #7 and #33) Red letters correspond to wild-type Rnd3 protein and blackletters correspond to the edited sequences. Asterisks represent STOP codons. (B) Rnd3 expression was analyzed by Western blot in different clones. Clone #33, showing no expression of Rnd3, was selected for further analysis (Rnd3 KO). (C) Rnd3 KO cells have no defects in cell growth. Rnd3 WT and KO cell cultures were analyzed as described in Methods. (D) Autophagy is not impaired in Rnd3 KO cells. Autophagy flux was analyzed in the presence or absence of serum. Inhibitors of lysosomal proteolysis (PI) were added to block lysosomal protein degradation. LC3-II levels were analyzed by Western blot (left) as described in Methods and its relative levels are plotted (right panel, n = 5). (E) Analysis of autophagy markers. Cells were treated as in (D) for 6 h and levels of the indicated autophagy markers were analyzed by Western blot (top panels) and relative values were plotted (bottom panels, n = 3). (F) Mitochondria are normally degraded in Rnd3 KO cells. Cells were treated with FCCP to induce mitochondria depolarization and/or with hydroxychloroquine (HCQ) to inhibit mitochondrial degradation. Cells were then stained with MTGreen and analyzed by flow cytometry as described in Methods. Mitophagy flux is plotted (n = 3) as the mean fluorescence intensity. UT, untreated. In all experiments ANOVA analysis showed no differences between Rnd3 WT and Rnd3 KO cells.

