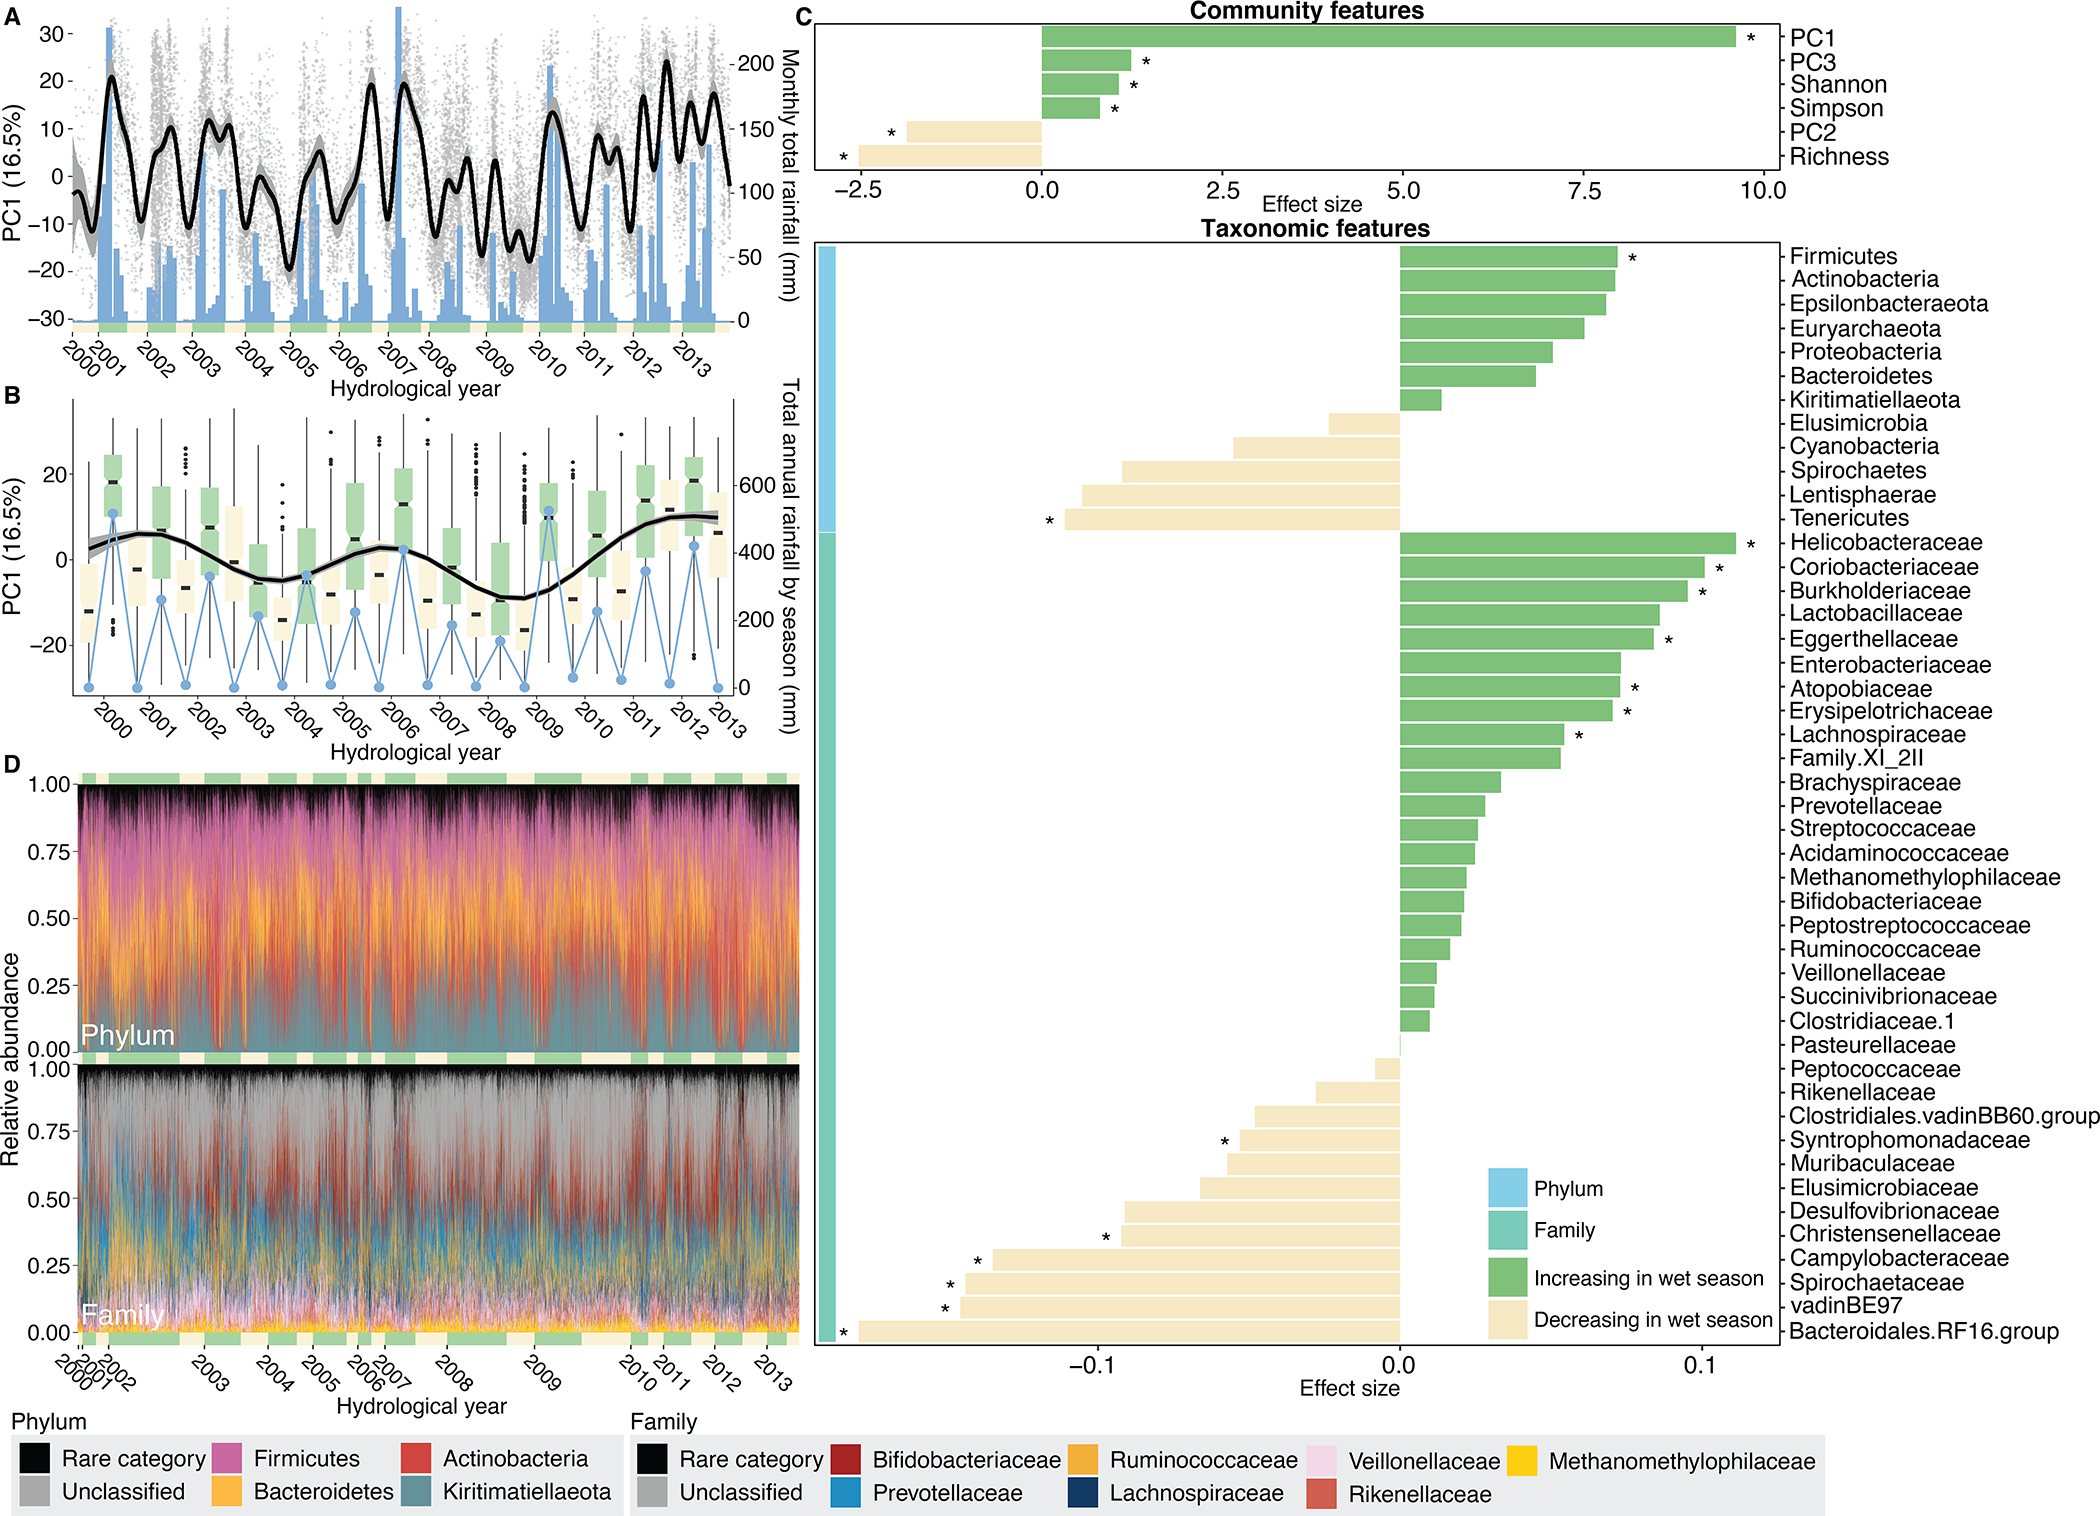
Fig. 2. Baboons show population-wide, cyclical shifts in microbiome community composition across seasons and years.

(A) Changes in microbiome PC1 mirror monthly rainfall across all 14 years. The grey points show values of PC1 for each of the 17,265 samples (y-axis) on the dates they were collected (x-axis). The thin black line and grey band are a plate regression spline and 95% simultaneous confidence interval for daily changes in microbiome PC1. Blue bars show monthly rainfall (right-hand y-axis), and the yellow and green bars along the x-axis represent dry and wet seasons, respectively, with the width reflecting the number of months within the focal year with at least 1 mm rainfall. (B) Changes in microbiome PC1 on an annual scale across all 14 years (N=17,265 samples). The box plots [box and whiskers indicate the median, 25th/75th percentile and 1.5 × interquartile range (IQR)] show the distribution of PC1 in wet (green) and dry (yellow) seasons. The thin black line and grey band are a plate regression spline and 95% simultaneous confidence interval for annual changes in microbiome PC1. Blue points show total annual rainfall (right-hand y-axis). (C) The effect of season varies across 52 features of the microbiome, including six community features (top panel) and 46 taxa (bottom panel; 12 phyla: light blue vertical bar; 34 families: turquoise vertical bar; for 341 ASVs, see Supplementary Fig. 13). Each horizontal bar shows the effect of season from linear mixed models for each feature. Asterisks indicate features that changed significantly between the wet and dry seasons (N=17,265 samples; FDR threshold=0.05). See Supplementary Fig. 6 and 7 for feature-specific smooths and Supplementary Fig. 8 and Supplementary Table 3 for results for ASVs. (D) Bar plots showing the relative abundance of ASVs colored by four most common microbial phyla (above) and the seven most common families (below) across all 17,265 samples. Green and yellow bars along the x-axes represent wet and dry seasons, with the width corresponding to the number of samples in the focal hydrological year and season. 22.9% of ASVs (78 of 341) could not be assigned to a known family (“unclassified”, shown in grey). The abundance of ASVs unclassified to family in the lower plot is ~35% because one unclassified ASV was the second most abundant ASV in the data set, with a mean abundance of 16.9% across all samples (ASV#2, phylum Kiritimatiellaeota, order WCHB1-41; Supplementary Table 2).
