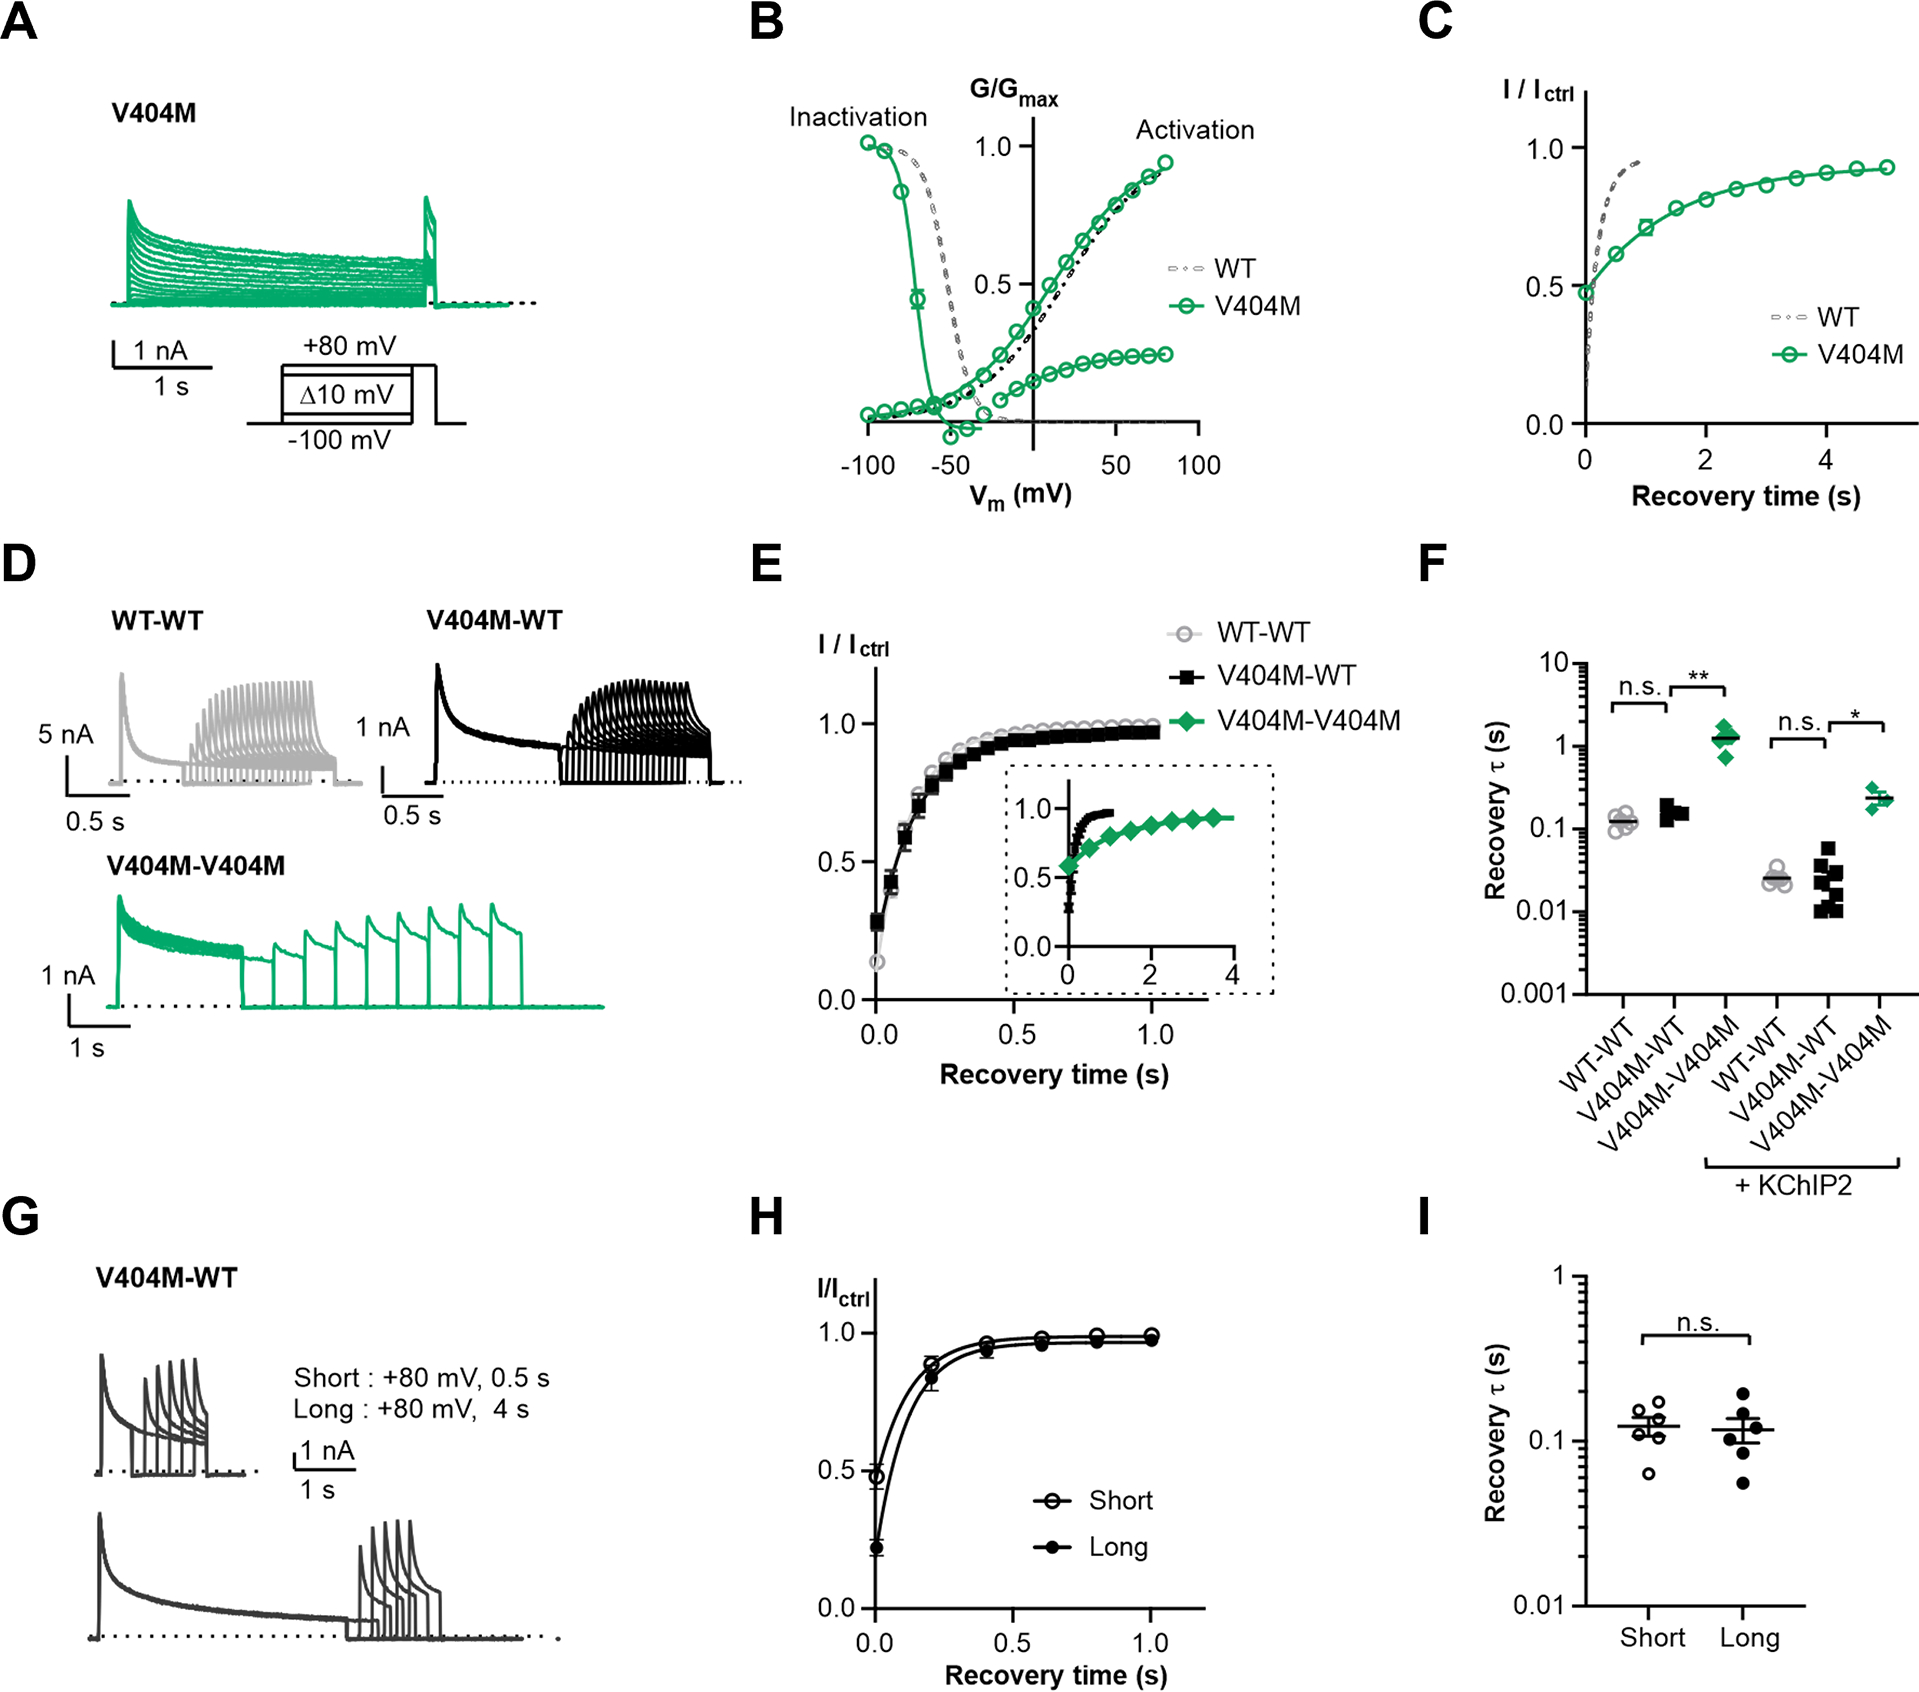
Figure 4. Two-fold inactivation stoichiometry probed by KV4 V404M.

(A) Representative whole-cell recording traces of KV4 V404M.
(B) Steady-state activation and inactivation curves of KV4 V404M. Data shown are mean ± SEM.
(C) Time course of V404M channels recovering from inactivation.
(D) Representative whole-cell recording traces of channels formed by concatenated subunits, showing the channel recovery from inactivation. The time constants of current decay are: WT-WT, τfast = 34±2 ms, τslow = 173±11 ms; V404M-WT, τfast = 104±10 ms, τslow = 1141±115 ms; V404M-V404M, τfast = 204±22 ms, τslow = 2641±343 ms.
(E) Time course of channels formed by concatenated subunits recovering from inactivation. For clarity, V404M-V404M is only included in the insert, displayed on a larger time scale. Data shown are mean ± SEM.
(F) Scatter plot showing recovery time constants (τ) of concatenated channels without or with KChIP2. Individual data points and mean values (horizontal black lines) are shown. *p < 0.05, **p < 0.01, n.s., not significant, as assessed by Dunnett’s test following Kruskal-Wallis test.
(G) Representative whole-cell recording traces with a long depolarizing step on V404M-WT channels. The depolarizing step here is either 0.5 s (short) or 4 s (long), whereas in (D) the step is 1 s for V404M-WT and 2 s for V404M-V404M.
(H) Time courses of V404M-WT channels recovering from inactivation shown in (G). Data shown are mean ± SEM.
(I) Scatter plot showing recovery time constants (τ) from recordings as in (G). Mean values (black lines) and SEM (whiskers) Are shown. n. s., not significant, as assessed by Welch’s t-test.
