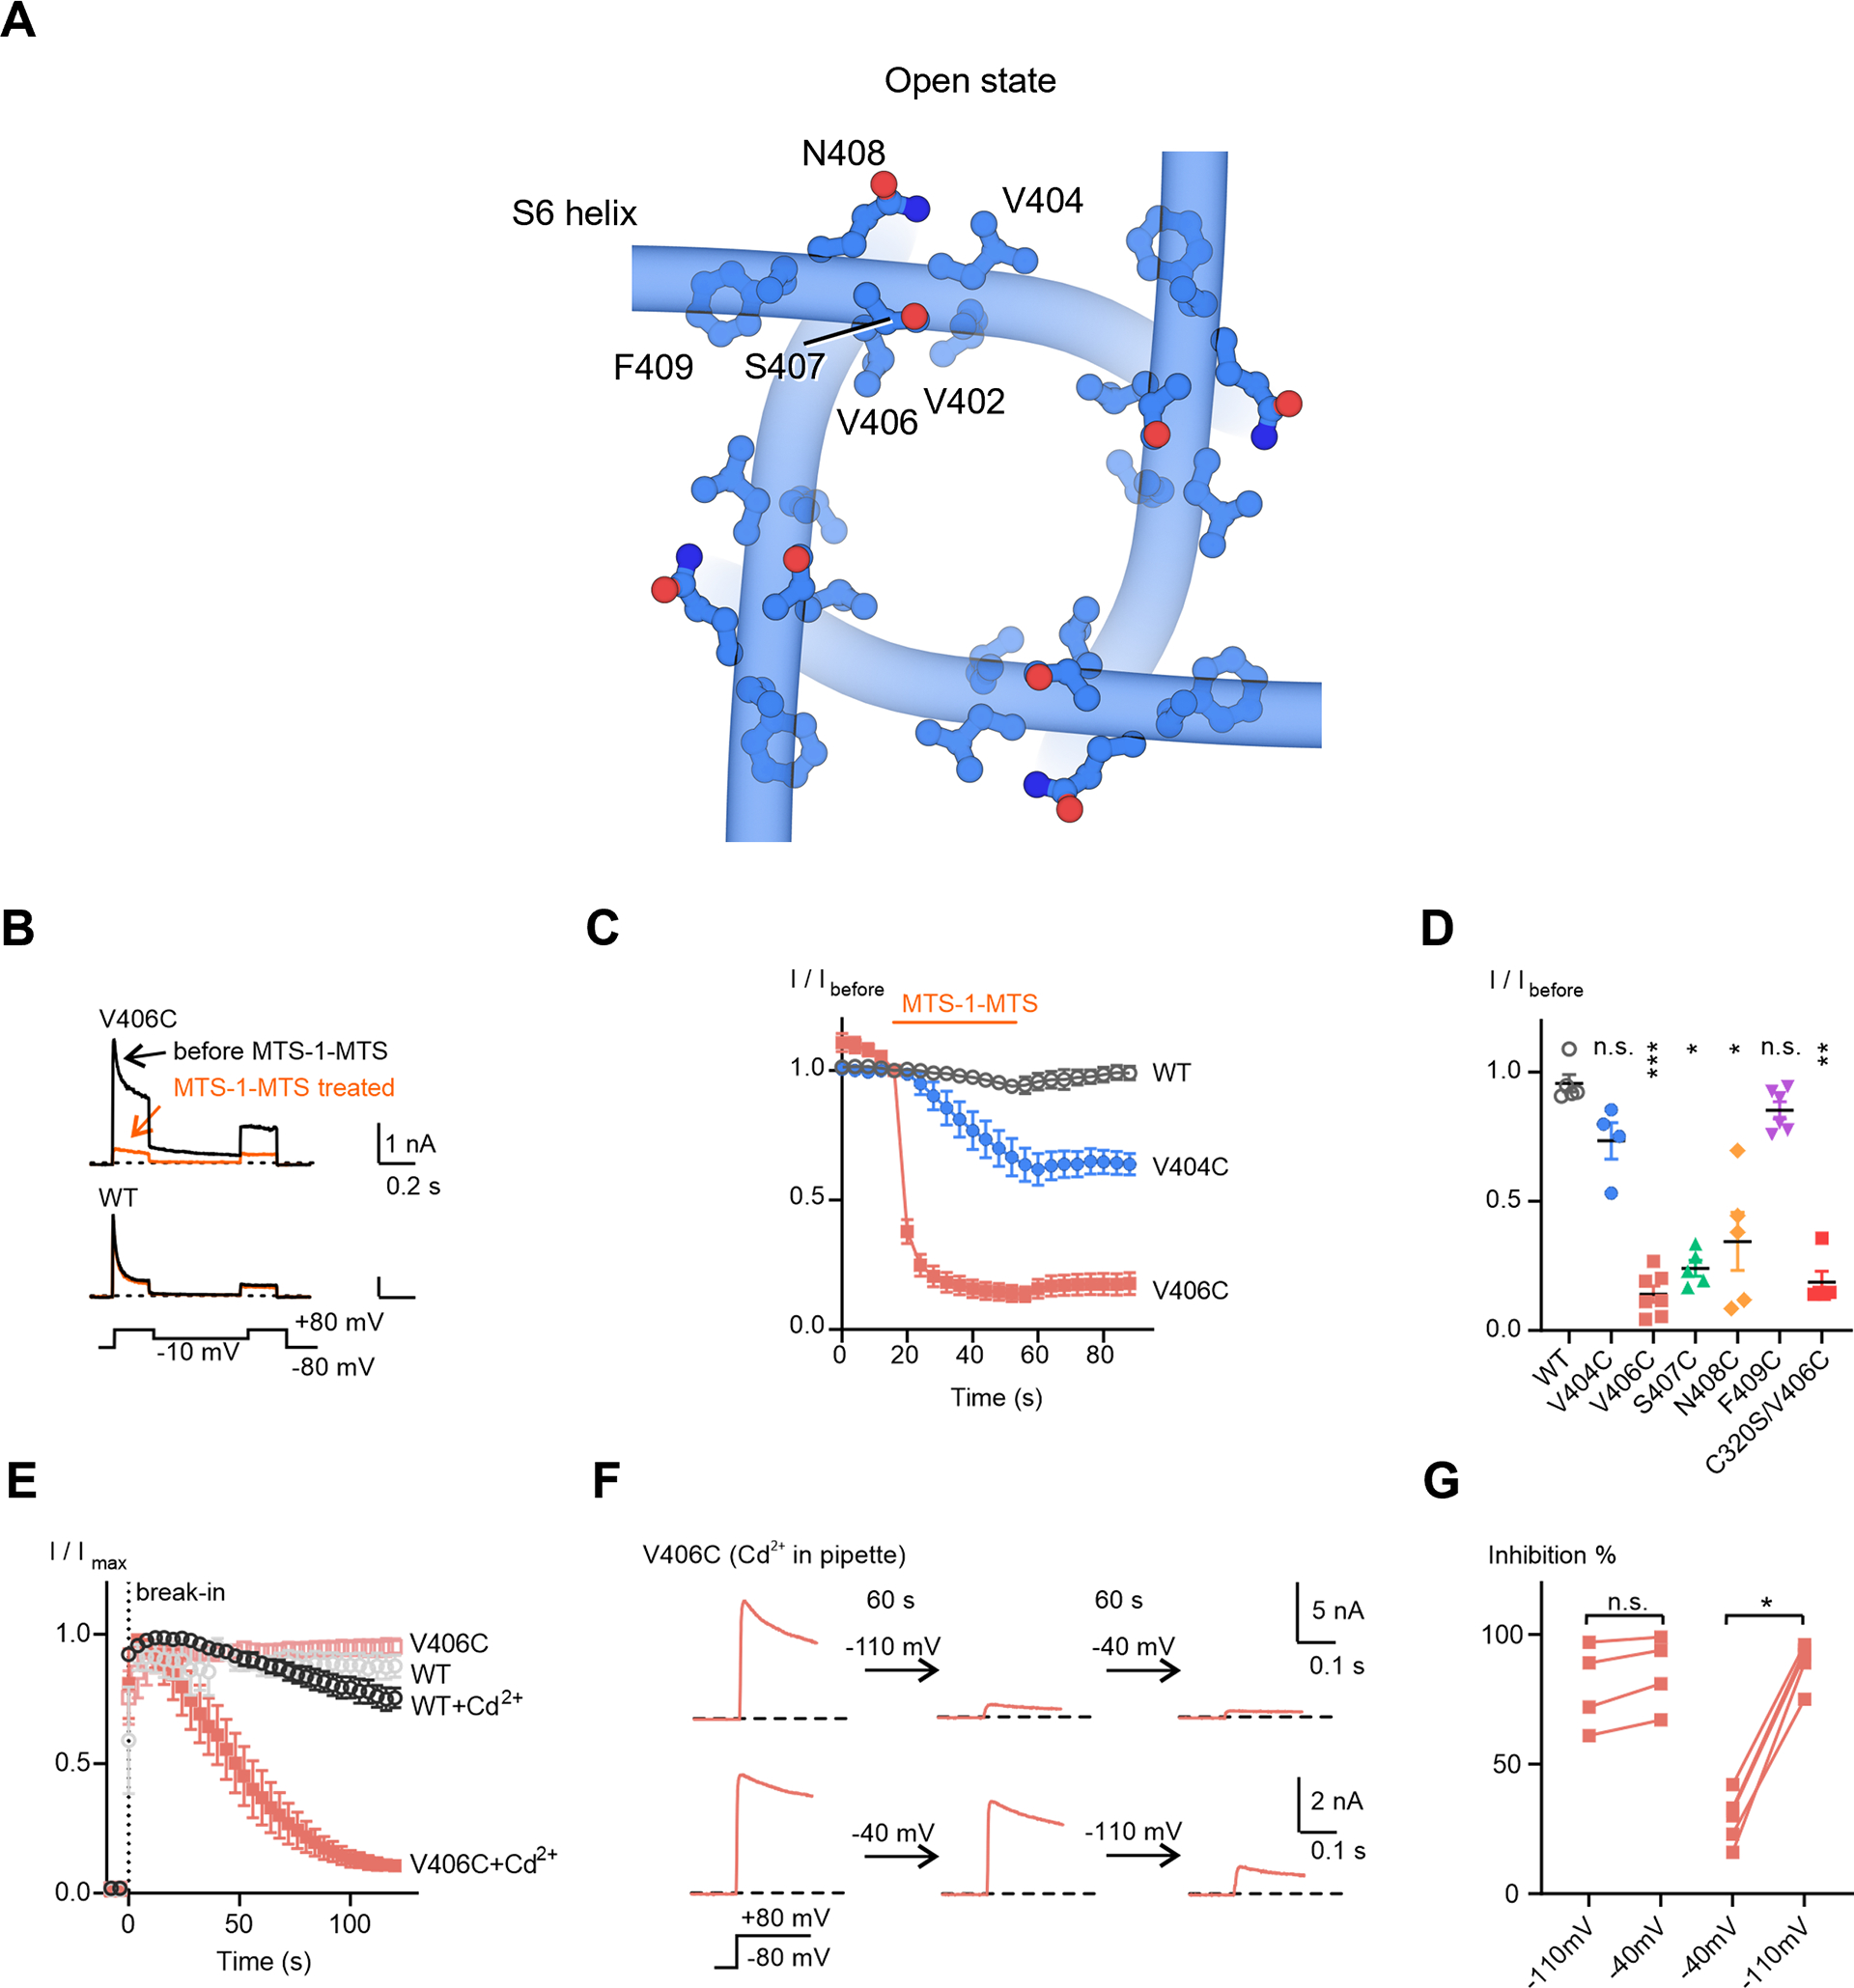
Figure 5. Crosslinking of Kv4 V406C in the resting state.

(A) Residues located C-terminally to the channel lower gate V402.
(B) Representative whole-cell recording traces of KV4 channels before and after a 40-second MTS-1-MTS treatment.
(C) Time courses of current responses to MTS-1-MTS treatment. The current magnitudes were normalized to that at the sweep before treatment (I/Ibefore) for each cell. Data shown are mean ± SEM.
(D) Scatter plot showing current responses to MTS-1-MTS treatment for each mutant. Mean values (horizontal black lines) and SEM (colored whiskers) are shown. *p < 0.05, **p < 0.01, ***p < 0.001, n.s., not significant, as assessed by Dunnett’s test following Kruskal-Wallis test.
(E) Time courses of changes in KV4 peak currents in the absence or presence Cd2+. The recordings start before breaking into the cells (before the 0 s time point). Data shown are mean ± SEM.
(F) Representative traces of KV4 V406C in the presence of Cd2+, showing the state-dependence of Cd2+ inhibition. Currents were evoked by a depolarizing step to +80 mV from −80 mV. After recording for 2 to 3 sweeps, the membrane potential was held at the indicated potentials for 60 seconds, followed by subsequent recordings with the same protocol.
(G) Summary of Cd2+ inhibition. Two sequential recordings from the same cell are connected by a line. *p < 0.05, n.s., not significant, as assessed by Dunnett’s test following Kruskal-Wallis test.
