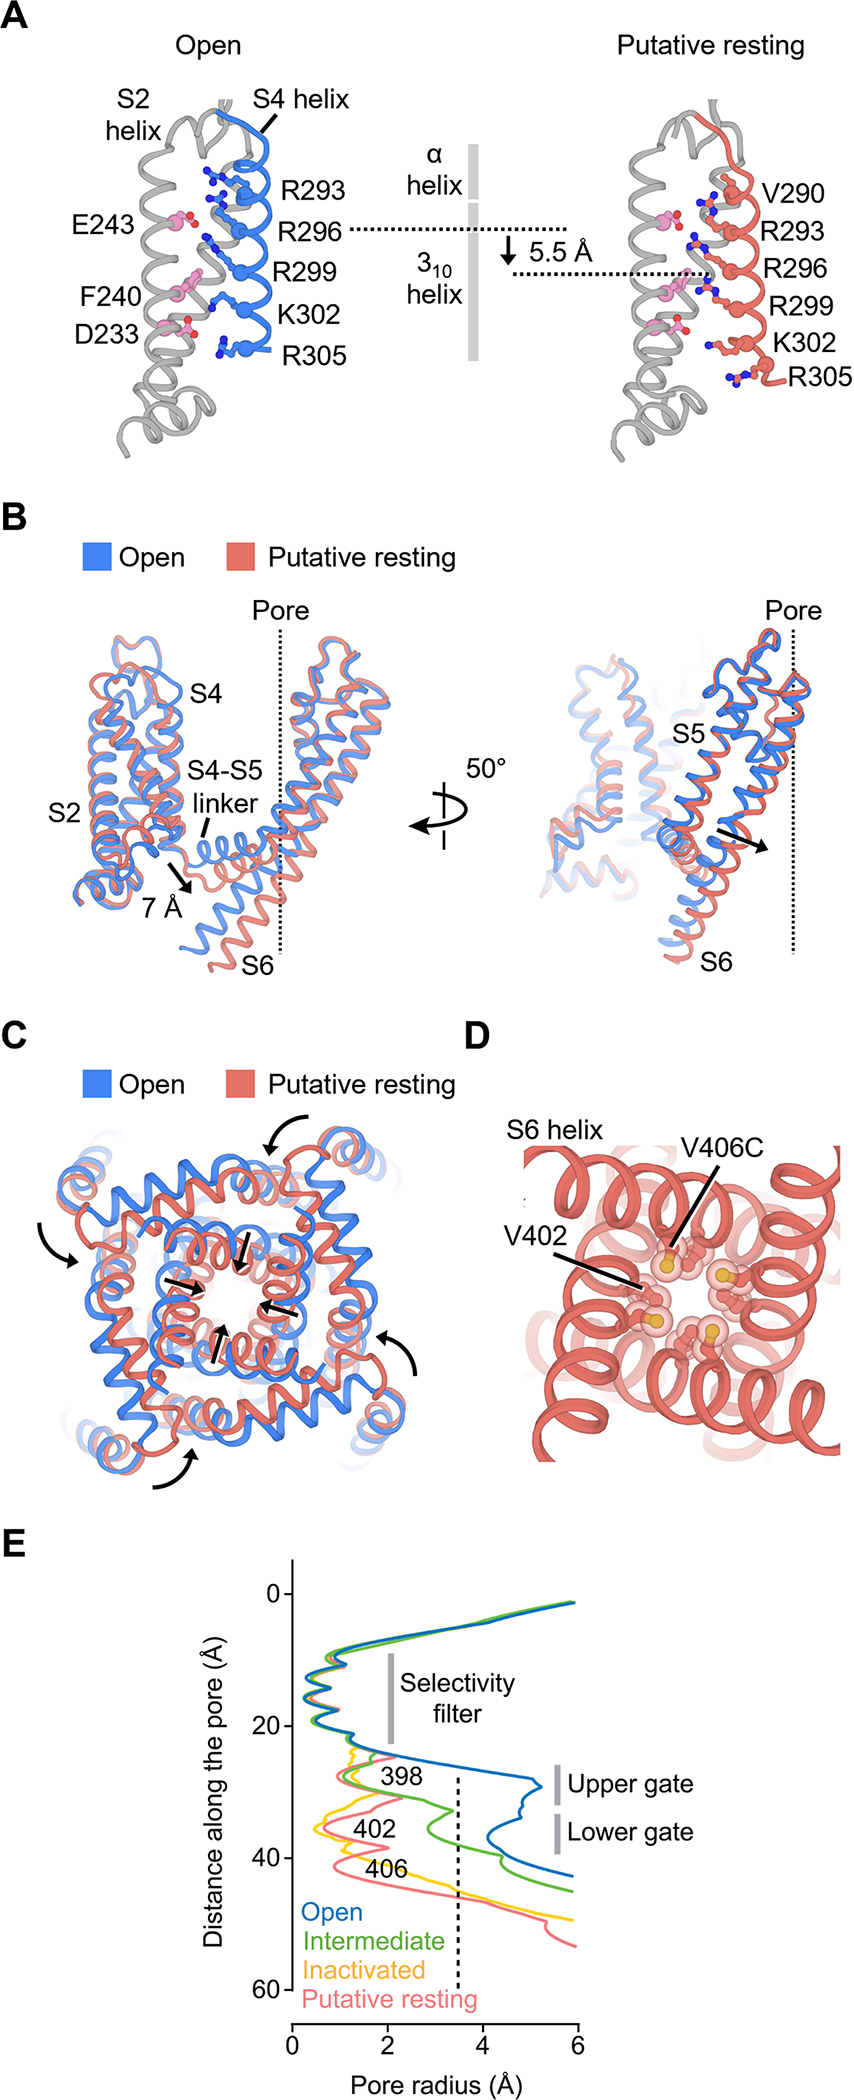
Figure 6. Structure of KV4 in the putative resting state.

(A) Movement of the S4 helix in the putative resting voltage sensor.
(B) Conformational changes of the S4-S5 linker and S5-S6 helices in the putative resting state. The central ion pathway is represented by a dash line
(C) Conformational changes of the pore in the putative resting state.
(D) Arrangement of V406C and the lower gate V402 residues in the putative resting state.
(E) Radius of the pore in different states. The radius is plotted as a function of the distance along the pore axis. The minimal pore radius for hydrated K+ ions to pass through (3.5 Å) is highlighted by a dash line.
