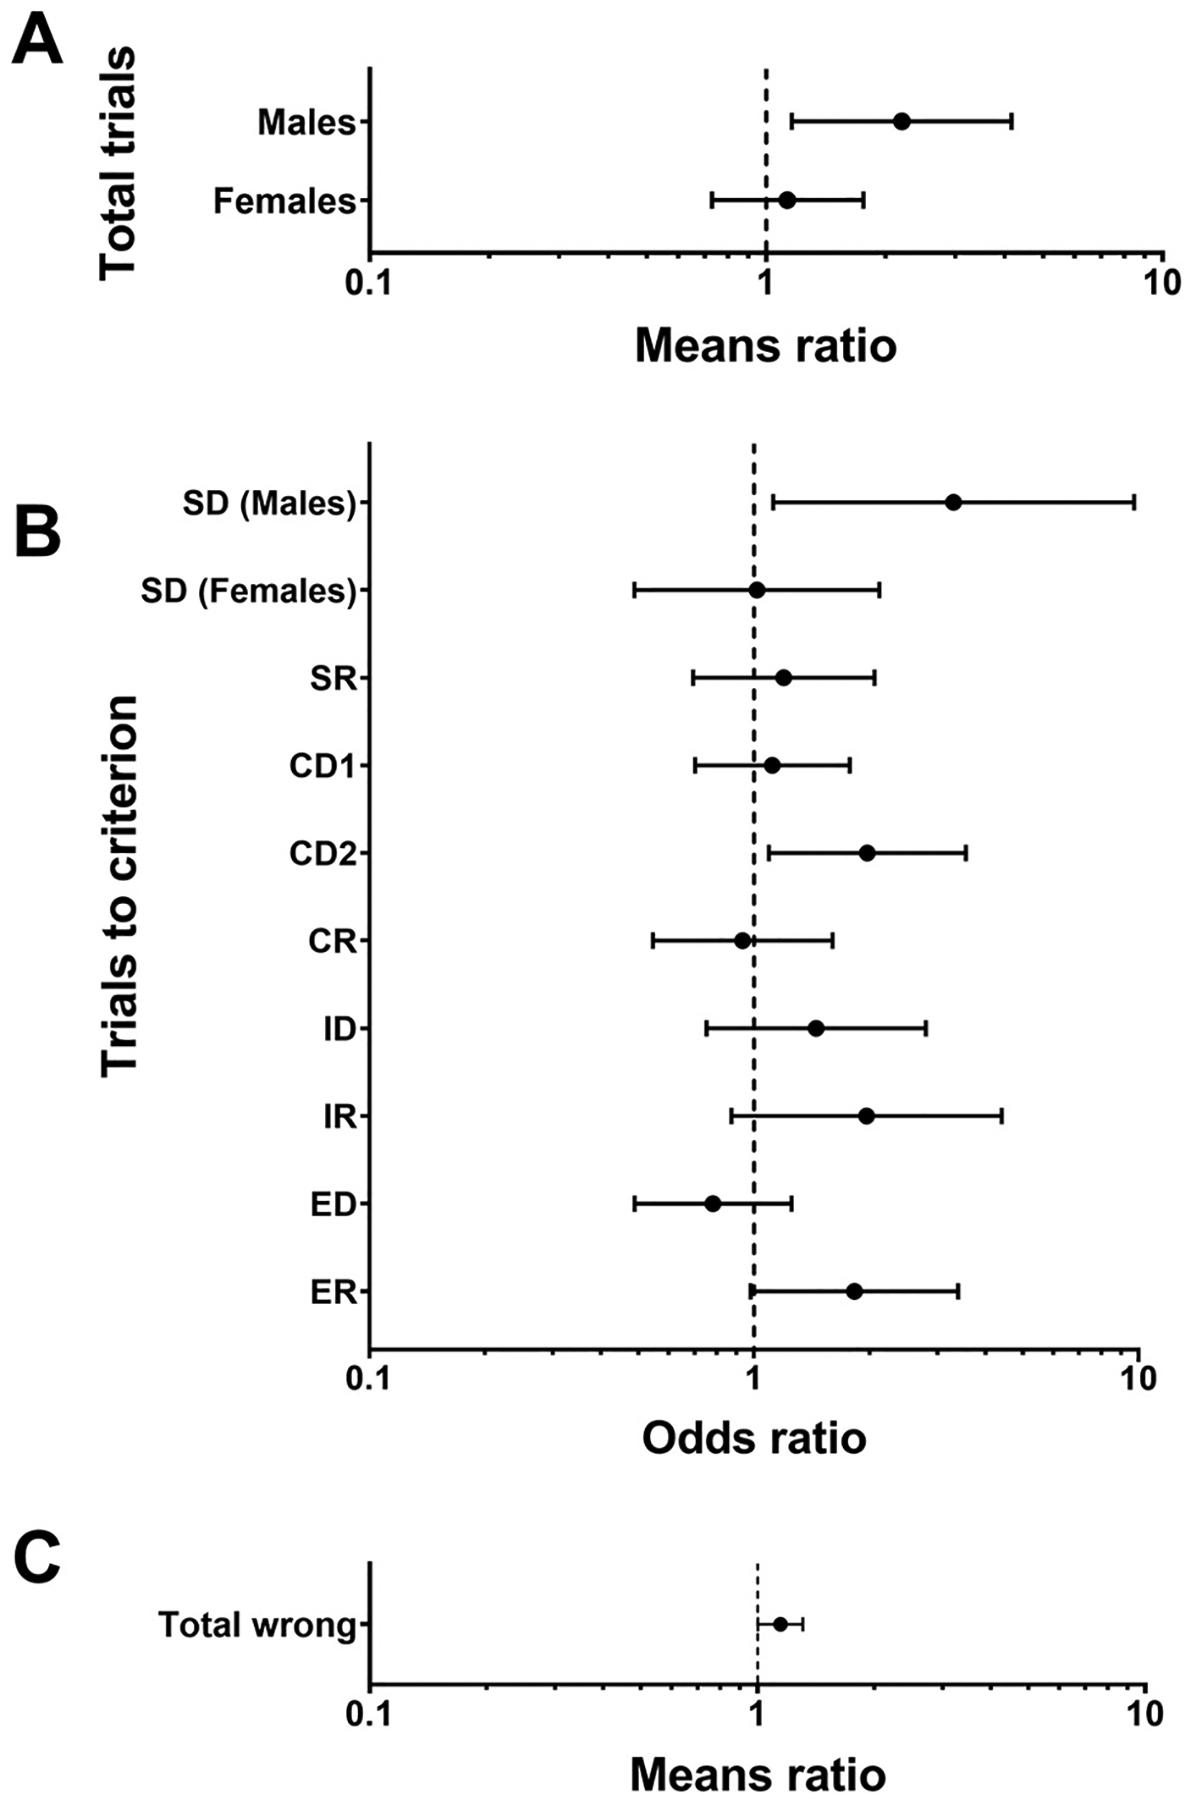
Fig. 2.

Associations between PCB serum concentrations and performance on ID/ED shift (n = 105) and DMS (n = 103). Means ratios and odds ratios are plotted on a log scale. (A) ID/ED shift: Total trials analyzed with negative binomial regression and associations reported as means ratio estimates (± 95% CL) for a 2 SD increase in PCB exposure on the log scale or a 6-fold increase in exposure on the original scale. (B) ID/ED shift: Trials to criterion for each stage analyzed with logistic regression and associations reported as odds ratio estimates (± 95% CL) for a 2 SD increase in PCB exposure on the log scale or a 6-fold increase in exposure on the original scale. (C) DMS: Total number of incorrect choices analyzed with negative binomial regression and associations reported as means ratio estimates (± 95% CL) for a 1 SD increase in PCB exposure on the log scale or a 2-fold increase in exposure on the original scale. All models were adjusted for age, sex, and IQ score. CL: confidence limit, SD: standard deviation.
