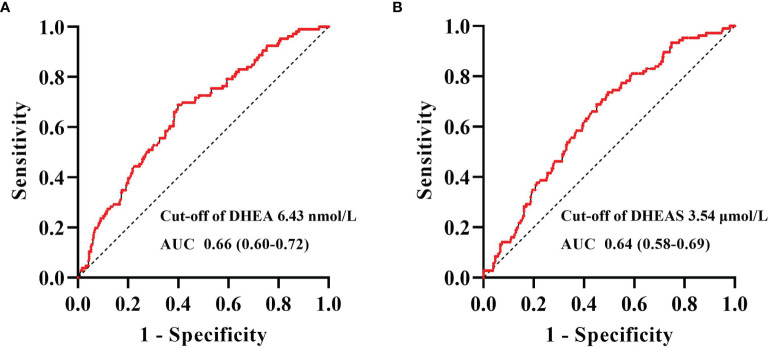
Figure 5.
Receiver operating characteristic (ROC) curve analysis of dehydroepiandrosterone (DHEA) and dehydroepiandrosterone sulfate (DHEAS) to recognize coronary heart disease (CHD) in men with type 2 diabetes mellitus. ROC curve analysis revealed that the areas under the curve (AUCs) for DHEA (A) and DHEAS (B) were 0.66 (95% CI = 0.60–0.72) and 0.64 (95% CI = 0.58–0.69), respectively. The optimal cutoff values, with the best trade-off between sensitivity and specificity, were 6.43 nmol/L for DHEA and 3.54 μmol/L for DHEAS.

