
FIGURE 3.
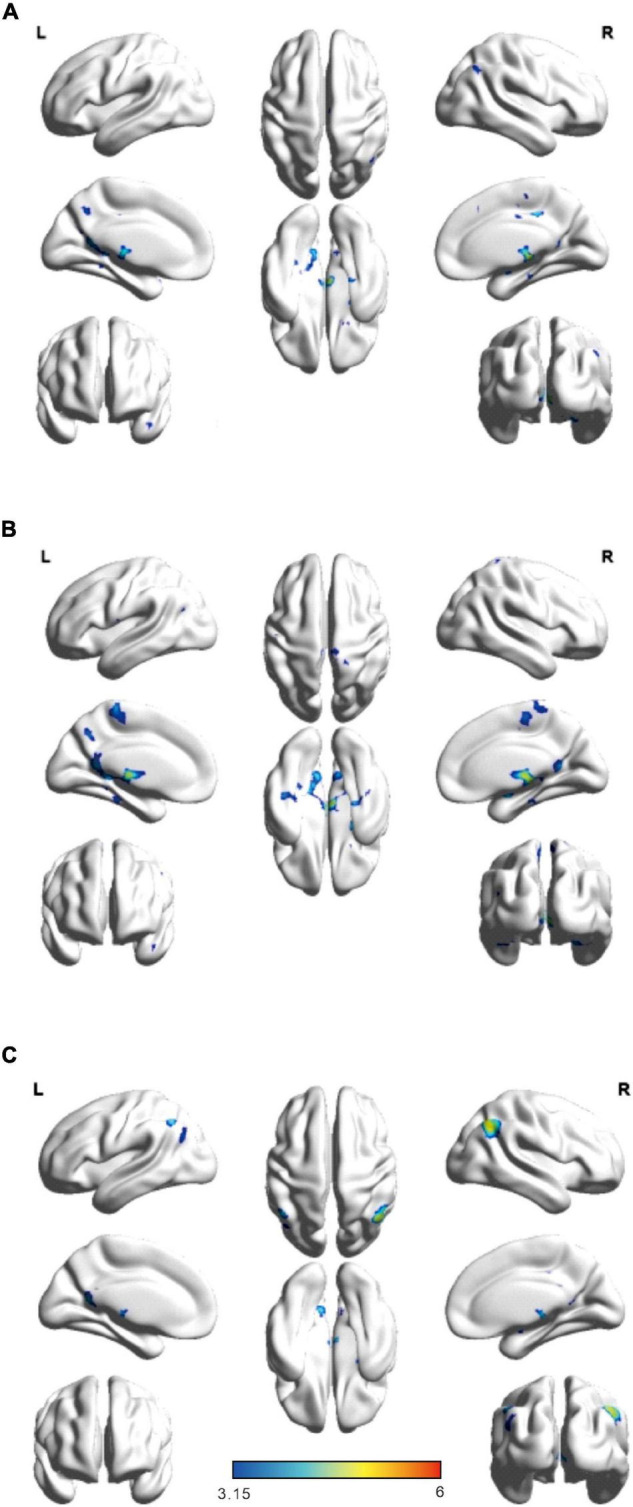
Significant brain network regions are rendered on the surface of the automated anatomical labeling atlas in BrainNet Viewer. (A) Significant difference network connectivity in the left executive control network with the whole brain. (B) Significant difference network connectivity in the right executive control network with the whole brain. (C) Significant difference network connectivity in the precuneus network with the whole brain. The significance threshold was set at p < 0.05 (false discovery rate-corrected, cluster size > 20). R, right; L, left.