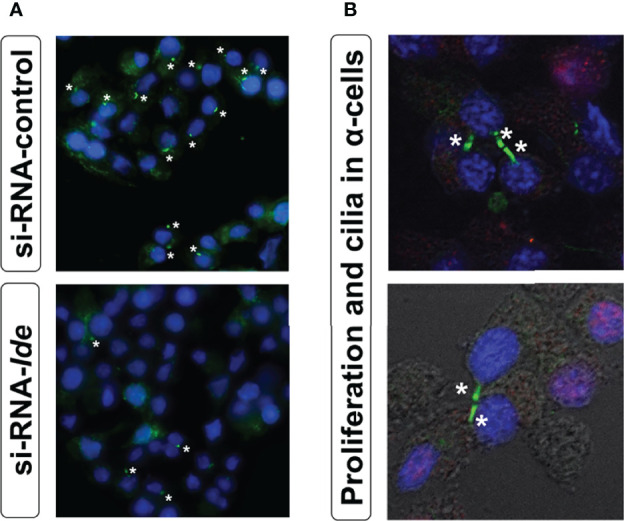
Figure 4.

(A) Loss of IDE expression reduces ciliated α-cells number. Representative epifluorescence microscopy (40X zoom) images of cilia signal in siRNA-Ide- and control-treated α-cells. Acetylated α-tubulin (green) and DAPI (blue). Asterisks indicate the presence of cilia. (B) Primary cilium and proliferation in α-cells. Representative fluorescence microscopy images of cilia signal obtained with confocal microscopy (60X zoom) in non-permeabilized α-cells. As seen in the images, proliferation (BrdU staining) was associated with unciliated cells. Acetylated α-tubulin (green), DAPI (blue), and BrdU (red).
