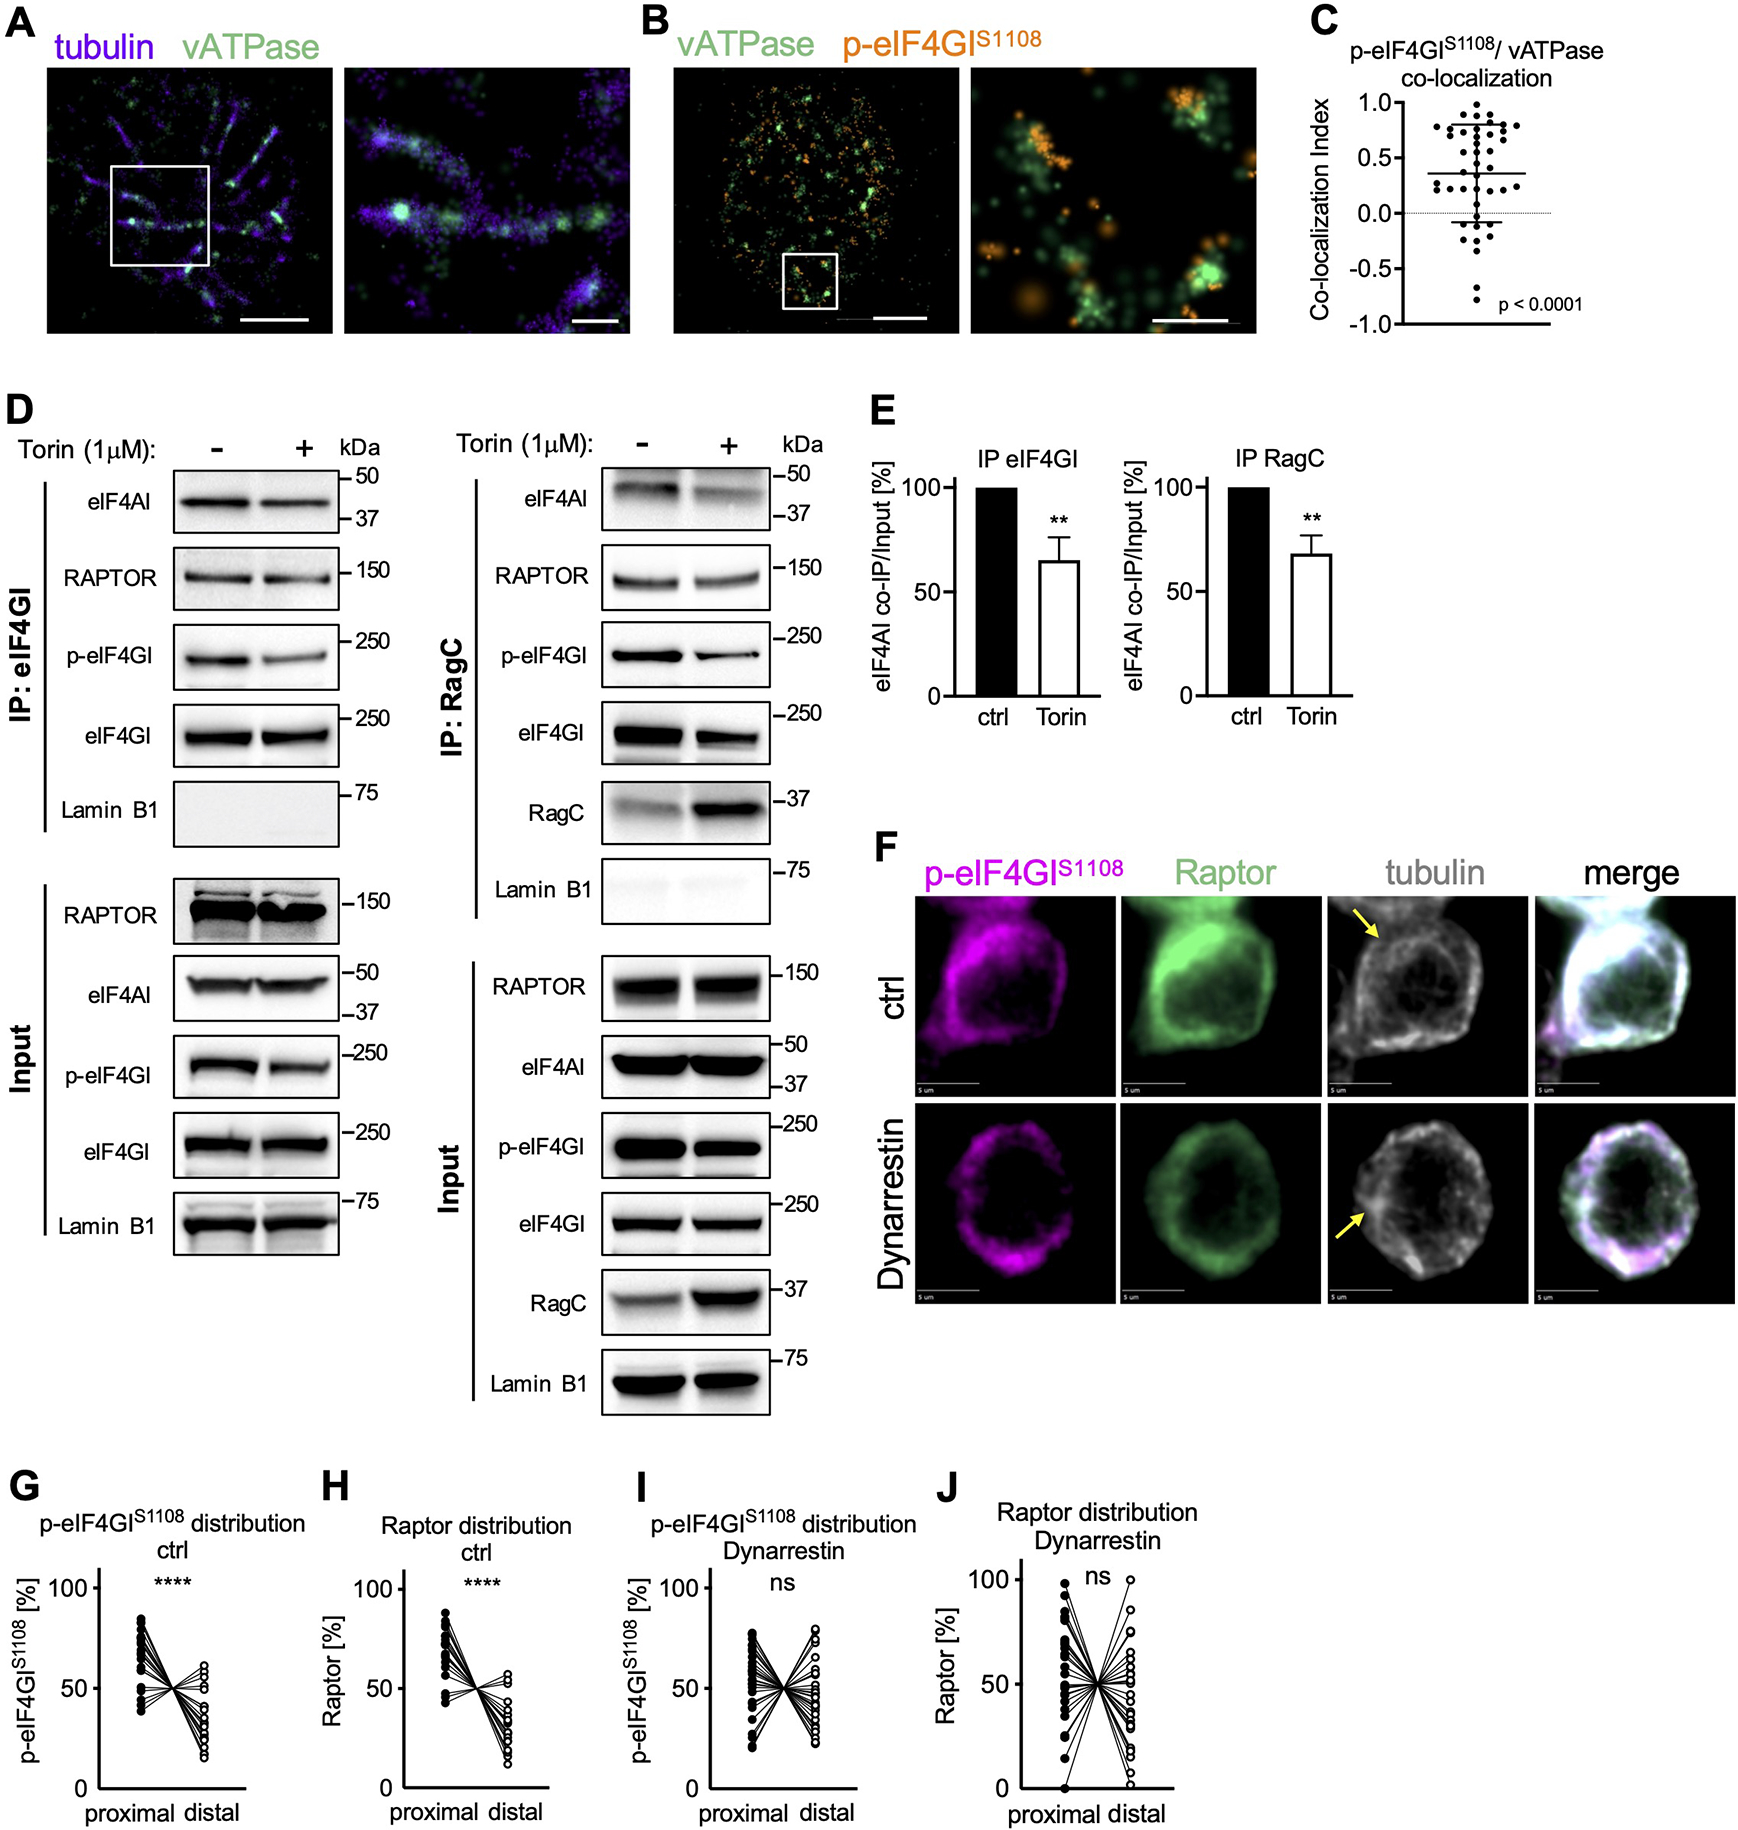
Figure 2. Dynein-dependent vesicular transport mediates polarization of the TORC1-eIF4F complex towards the proximal pole of activated, undivided OT-I CD8+ T cells.

OT-I CD8+ T cells activated on antibody-coated slides as in Figure 1A (A-C) or peptide-pulsed APCs (D-J). (A-C) Association of p-eIF4GIS1108 with vATPase+ vesicular structures along microtubules visualized by STORM. Scale bar wide field (left): 2 μm, zoom (right): 0.5 μm. Representative images (A, B) and quantification (C). (D, E) Co-Immunoprecipitation of eIF4GI (left) and RagC (right) in OT-I CD8+ T cells activated on APCs for 24 h and treated with Torin for the last hour of activation. Representative Western blot (D) and densitometric quantification (E). (F) Representative images of undivided OT-I CD8+ T cells activated on peptide-pulsed APCs and treated with Dynarrestin for the last hour of activation. Scale bar: 5 μm. (G-J) Quantification of the distribution of p-eIF4GIS1108 (G, I) and Raptor (H, J) in control (G, H) and treated (I, J) cells. Each dot represents signal in the proximal or distal half of a cell. A line connects data points from two halves of the same cell. Arrows mark MTOCs. Compiled from three (C, G-J) or four (E) independent experiments. Significance was calculated with Wilcoxon signed-rank test against 0 (C) or paired (E, G-J) Student’s t-test; **p<0.01, ****p<0.0001, ns=not statistically significant. See also Figure S2.
