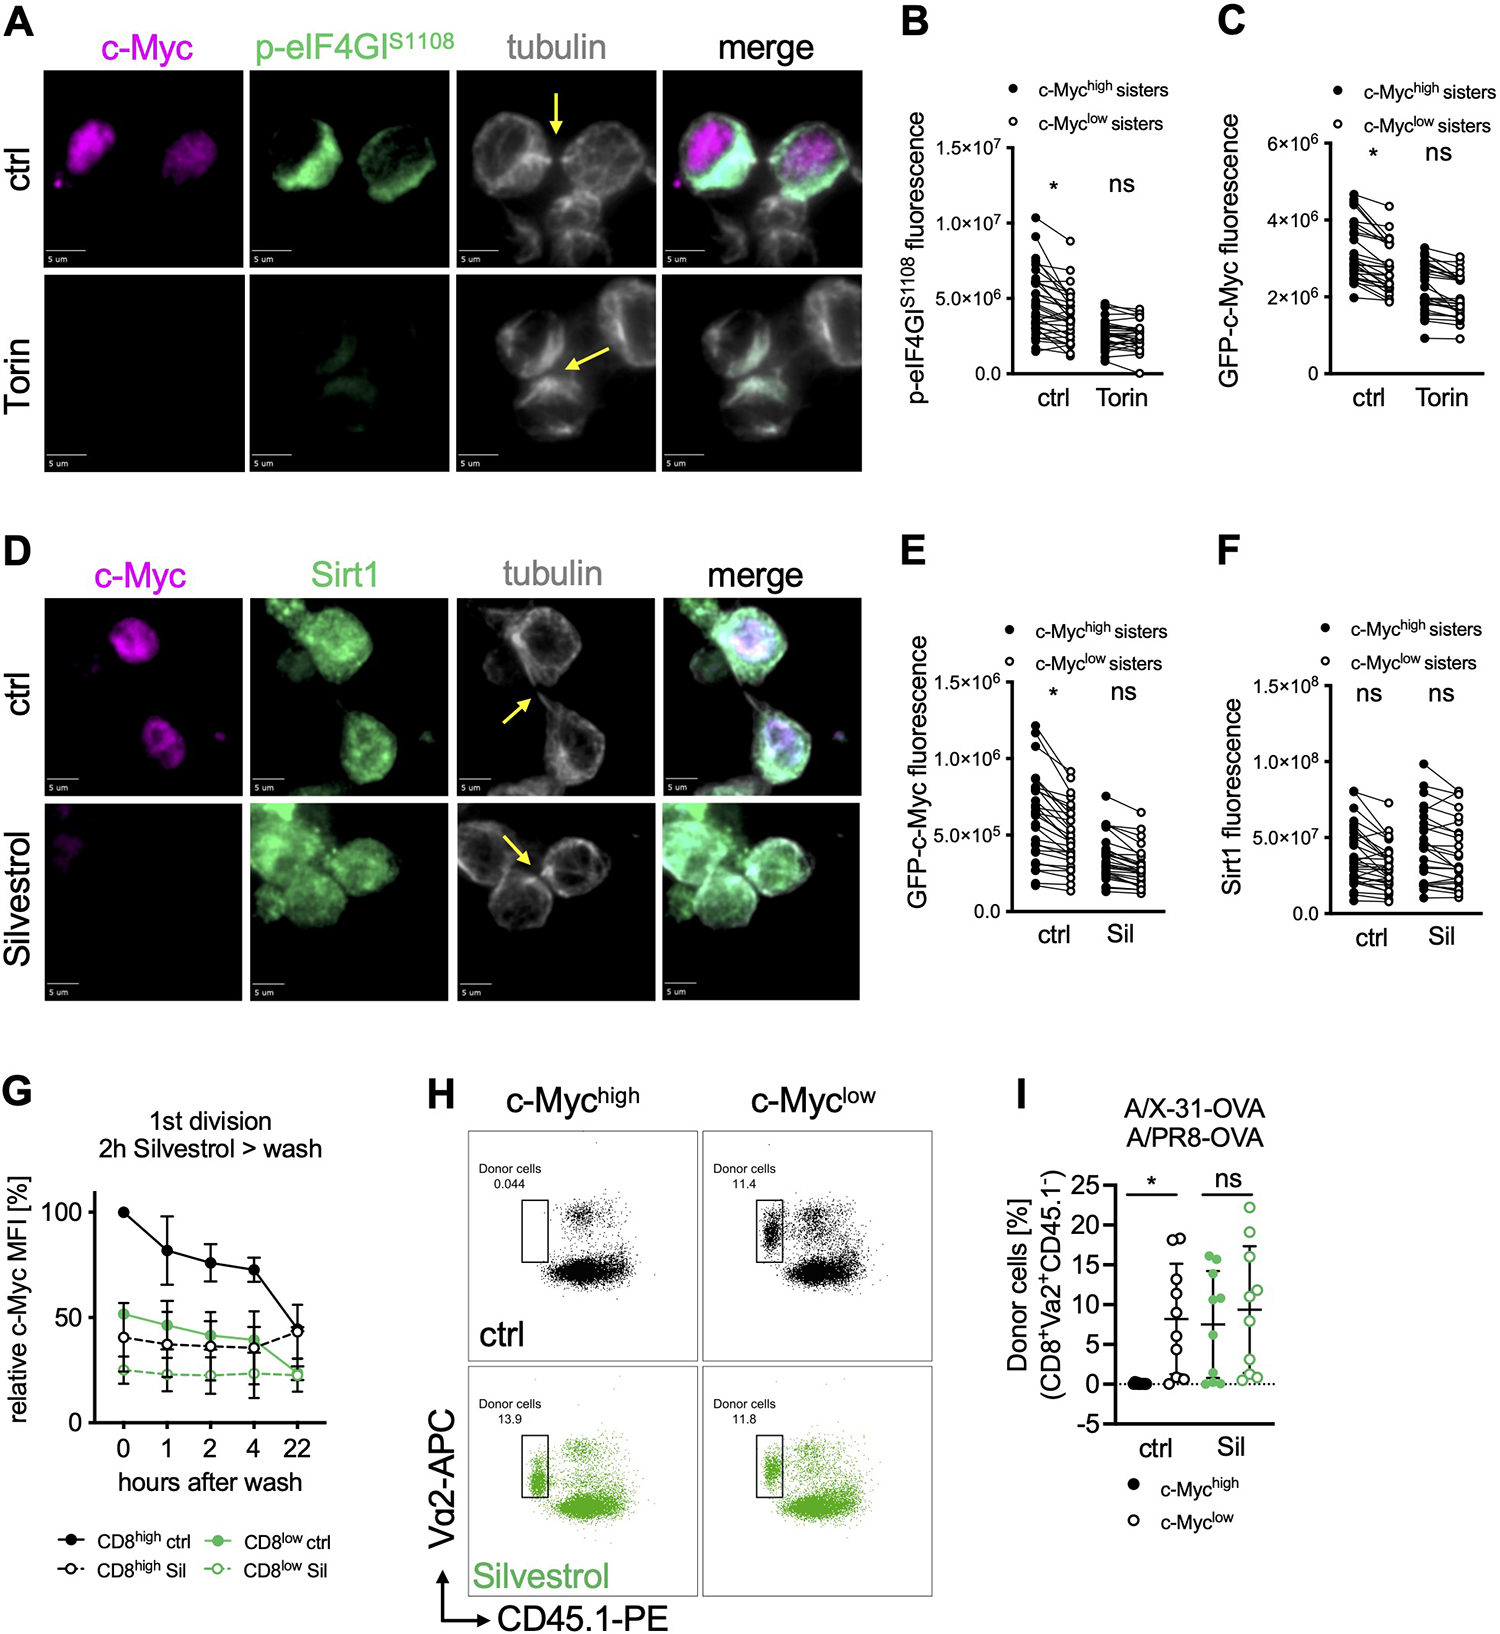
Figure 4. Inhibition of eIF4A at the time of first division promotes memory-like function.

(A) Representative images of conjoined daughter OT-I GFP-c-Myc CD8+ T cells activated for 28 h on peptide-pulsed APCs and treated with Torin for the last hour of activation. Scale bar: 5 μm. (B, C) Quantification of sum fluorescence intensity of p-eIF4GIS1108 (B) or GFP-c-Myc (C) in conjoined sister cells. Each dot represents one cell, data points of sister cells are connected by a line. (D) Representative images of conjoined daughter OT-I GFP-c-Myc CD8+ T cells activated for 28 h on peptide-pulsed APCs and treated with Silvestrol for the last hour of activation. Scale bar: 5 μm. (E, F) Quantification of sum fluorescence intensity of GFP-c-Myc (E) or Sirt1 (F) in conjoined sister cells. Each dot represents one cell, data points of sister cells are connected by a line. (G) MFI of GFP-c-Myc by FACS analysis. OT-I GFP-c-Myc CD8+ T cells were activated for 36 h on peptide-pulsed APCs, treated with Silvestrol for 2 hours, washed and cultured for the indicated time; mean +/− SD, relative to CD8high ctrl. (H, I) Frequency of OT-I GFP-c-Myc CD8+ donor cells (congenic wild type recipients) on day 9 after A/PR/8-OVA challenge. First-division c-Mychigh or c-Myclow cells, treated with Silvestrol for 2 h after sorting, were adoptively transferred into recipient animals before infection with A/X-31-OVA (day 0) and challenge with A/PR/8-OVA (day 30). Representative FACS plots (H) and quantification (I). Each dot represents a recipient animal, n=10; mean +/− SD. Arrows mark tubulin bridges. Compiled from two (G, I) or three (B, C, E, F) independent experiments. Significance was calculated with ANOVA (B, C, E, F, I); *p<0.05, ns=not statistically significant. See also Figure S4 and Table S1.
