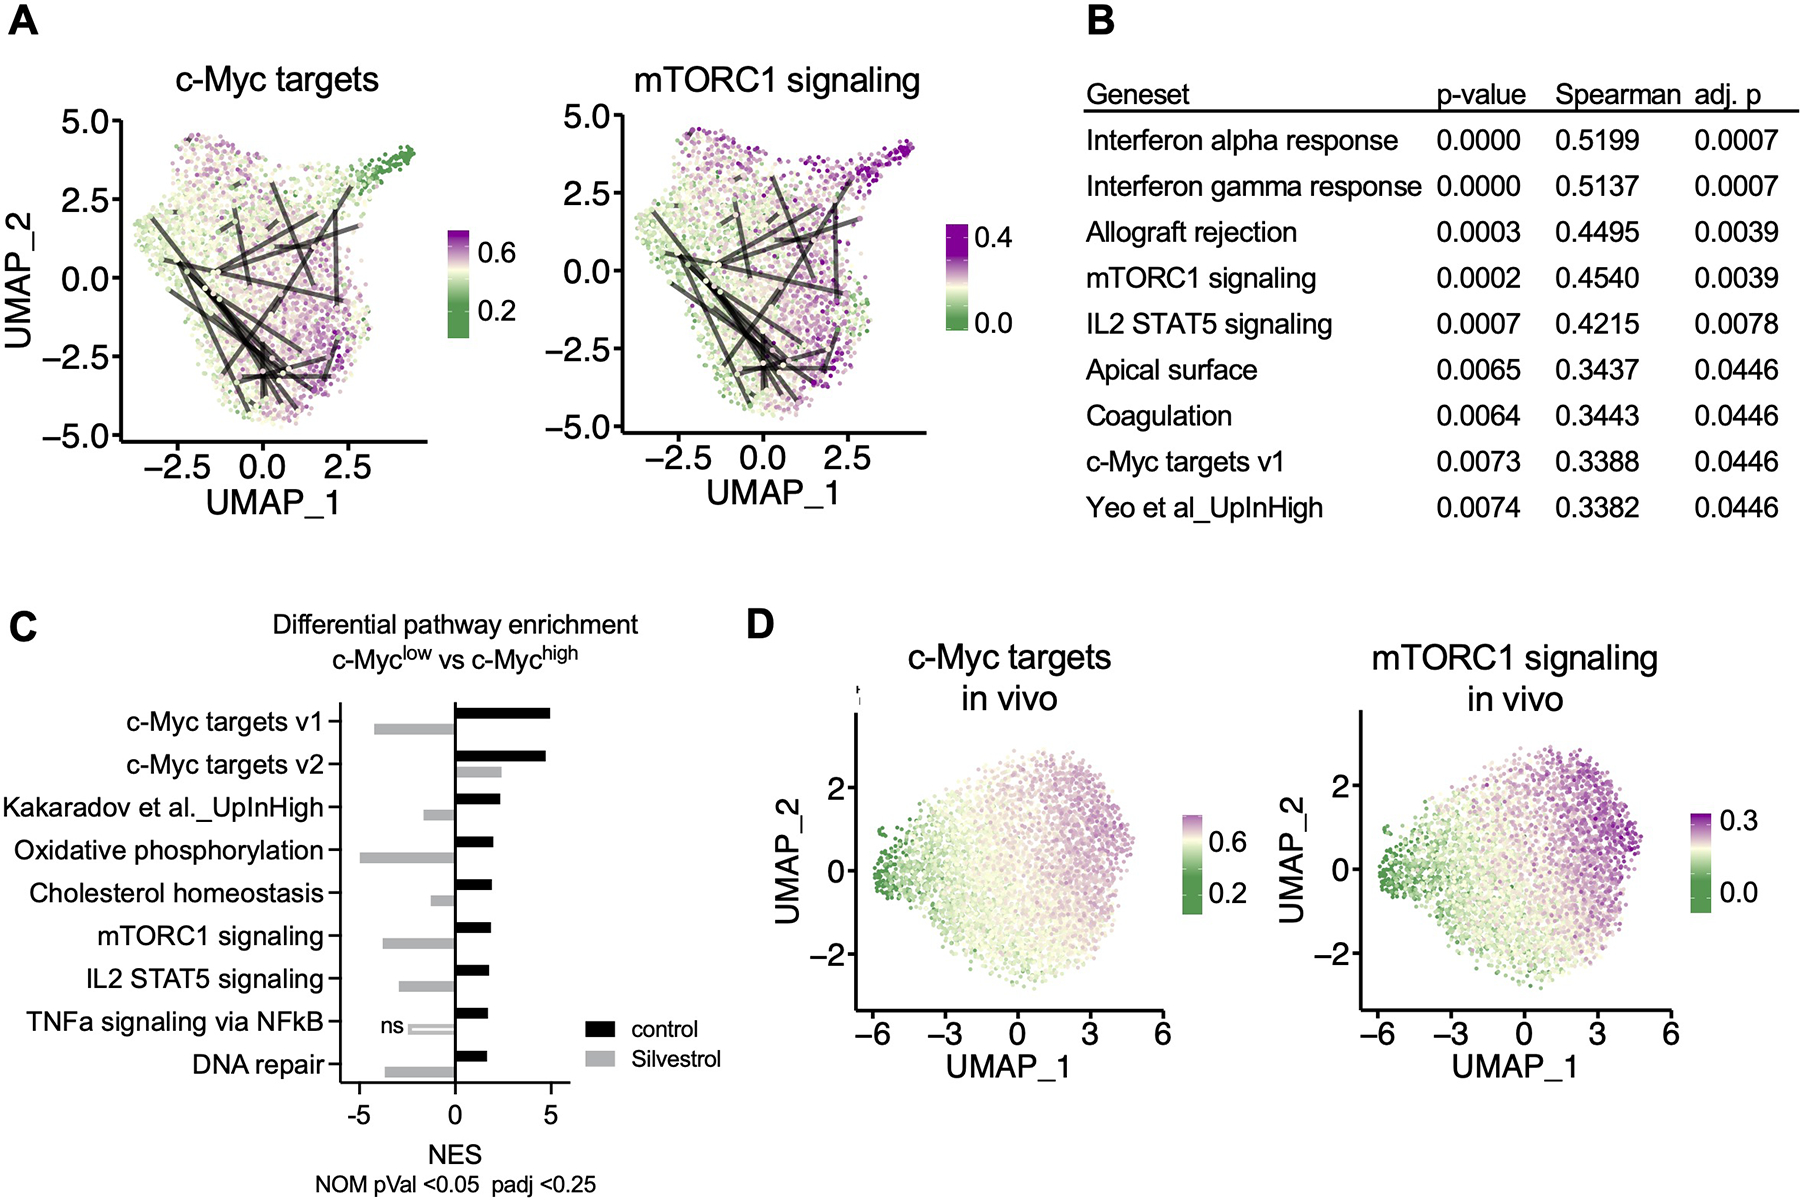
Figure 5. Transcriptional heterogeneity in sister cells is established as early as the first division.

OT-I BCM CD8+ T cells were active for 36h on peptide-pulsed APCs and subjected to single cell RNA-Seq (A, B, D) or microarray (C). (A) Uniform Manifold Approximation and Projection (UMAP) plots representing single-cell gene expression data of murine first division OT-I BCM CD8+ T cells obtained from barcode experiment replicate A. Lines connect putative sister cells. Color gradient corresponds to specific gene set module scores, where the gradient midpoint (light yellow) is set to the median module score. (B) Statistical summary of Spearman correlations between pairwise Euclidian PCA distances and absolute differences in gene set module scores for putative sister cell pairs. P-values were adjusted to an FDR <0.05, and only correlations with an adjusted p-value of <0.05 were included. (C) Gene Set Enrichment Analysis comparing first-division c-Mychigh and c-Myclow sorted cells, control or treated with Silvestrol for the last hour of activation. Normalized Enrichment Score (NES) is presented for each treatment for all gene sets that were significantly (p < 0.05, FDR < 0.25) enriched in the c-Myc high control condition. Positive NES corresponds to enrichment in the c-Myc high condition, negative NES corresponds to enrichment in the c-Myc low condition. (D) UMAP plots representing single-cell gene expression of first-division OT-I GFP-c-Myc CD8+ T cells obtained from replicate A of three independent in vivo experiments, otherwise presented as described in (A). See also Figure S5.
