
Figure 7.
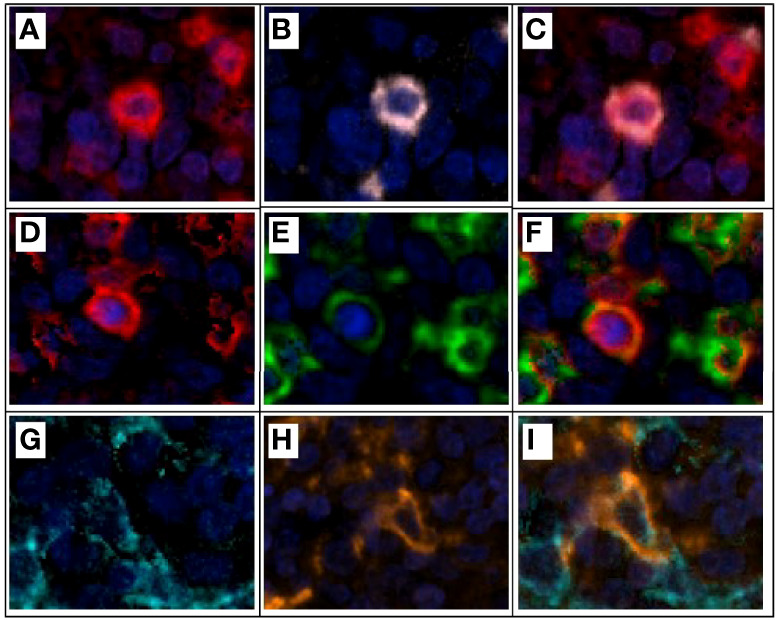
Multiplex immunofluorescence and colocalization examples. (A) CD3+ expression (red) on a lymphocyte T. (B) CD8+ expression (pink) of the same lymphocyte T in example (A). (C) CD3+ and CD8+ expression and colocalization (red and pink) for a cytotoxic T lymphocyte. (D) CD3+ expression (red) on a lymphocyte T. (E) PD1+ expression (green) of the same lymphocyte T in example (D). (F) CD3+ and PD1+ expression and colocalization (red and green) for a T lymphocyte PD1+. (G) Cytokeratin+ expression (cyan) of an epithelial tumor cell. (H) PDL1+ expression (orange) of the same epithelial tumor cell on example (G). (I) Cytokeratin+ and PDL1+ expression and colocalization (cyan and orange) on an epithelial tumor cell expressing PDL1 on its surface for immune evasion. Composite image from inform ® image analysis software, Akoya bioscience. Scanner Vectra Polaris.