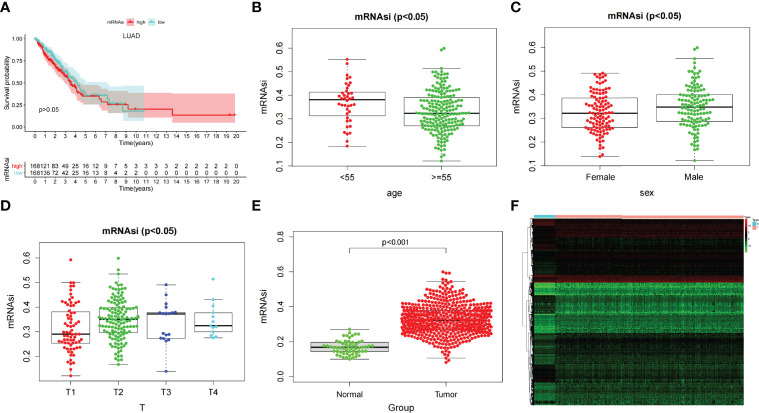
Figure 2.
(A) Kaplan–Meier displays no significant difference between the high- and low-mRNAsi groups. (B–D) The correlation of global mRNAsi profiles with LUAD clinical subtypes: (B) age, (C) sex, and (D) T staging. (E) Different analysis of the mRNAsi level between normal and LUAD tissues. (F) The heat map of DEGs in LUAD.

