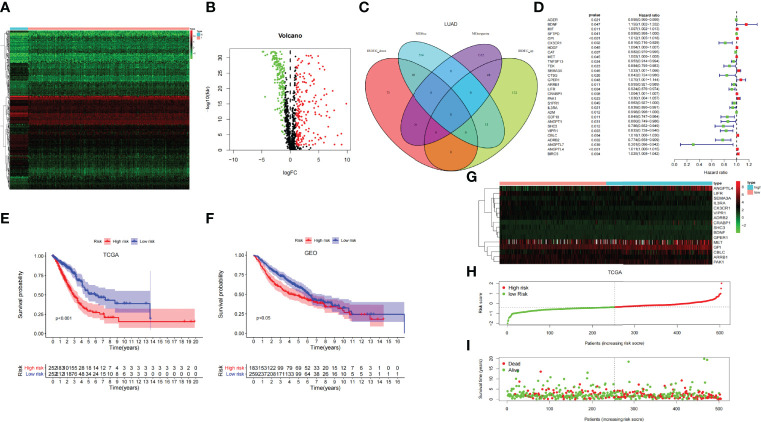
Figure 4.
(A) The heat map of immune-related DEGs in LUAD. (B) Volcano map of immune-related DEGs in LUAD. Green, downregulated genes; red, upregulated genes. (C) Venn diagram of the intersection genes related to both mRNAsi and immunity. (D) Univariate COX regression analysis of prognosis-related stem cell and immune-related differential genes (SCIRGs) in LUAD. (E, F) Kaplan–Meier curves show a considerable difference between the high- and the low-risk groups. (G) Heat maps of the hub genes’ expression pattern, where the red to green means changes from high to low expression in TCGA. (H) Distribution of multi-genes signature risk score in TCGA datasets. (I) The survival status and interval of TCGA-LUAD patients.

