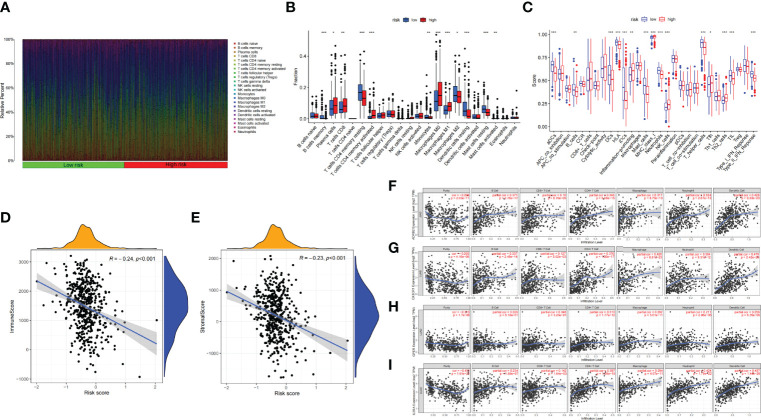
Figure 7.
(A) Bar plot presents the distribution of 22 kinds of TICs in LUAD tumor samples. Column names represent sample ID. (B) Bar plot presents the difference of TICs between the high- and low-risk groups. (C) Bar plot presents the difference of immune-related function between the high- and low-risk groups. (D, E) Association between tumor immune microenvironment (TIME) and risk score. (D) ImmuneScore; (E) StromalScore. (F, I) TIMER: Immune correlation analysis of SCIRGs in the model based on immune infiltration, (F) ADRB2, (G) CX3CR1, (H) GPER (GPER1), and (I) IL3RA. *p < 0.05, **p < 0.01, ***p < 0.001.

