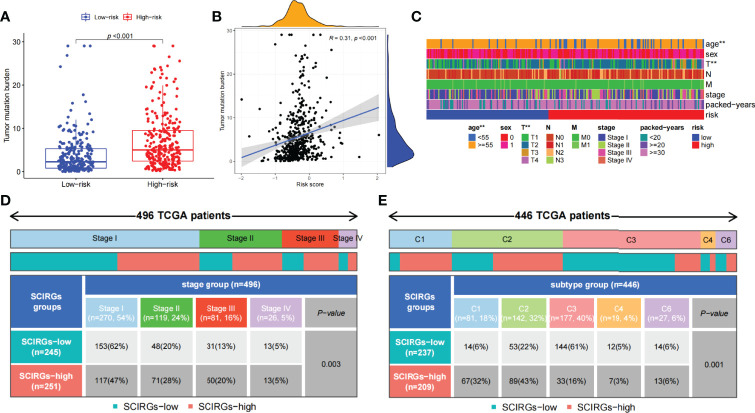
Figure 8.
(A) The difference of TMB between the high- and low-risk groups. (B) Association between TMB and risk score. (C) The proportion of clinical characteristics of every sample in relative risk group was presented in heat map. (D) Proportion of patients in different stages of high- and low-risk groups. (E) Proportion of patients in different immune sub-typing of high- and low-risk groups. *p < 0.05, **p < 0.01, ***p < 0.001.

