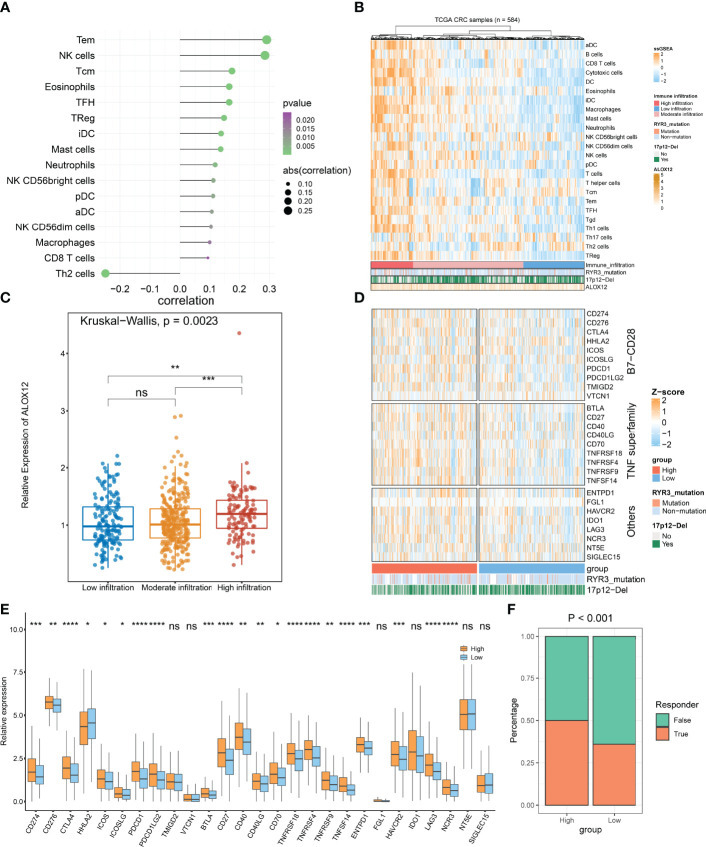
Figure 8.
Tumor immune microenvironment landscape, immune checkpoint profiles, and immunotherapy response prediction of ALOX12 in TCGA-CRC. (A–C) The correlation analysis between ALOX12 and 24-immune-cell infiltration abundance. (D, E) Heatmap and boxplot of 27 immune checkpoint profiles in high and low ALOX12 expression groups. (F) The result of the tumor immune dysfunction and exclusion (TIDE) method. *P < 0.05, **P < 0.01, ***P < 0.001, ****P < 0.0001. ns, no significance..

