
Figure 1: Impact of maternal BMI on umbilical cord blood T and B cell populations.
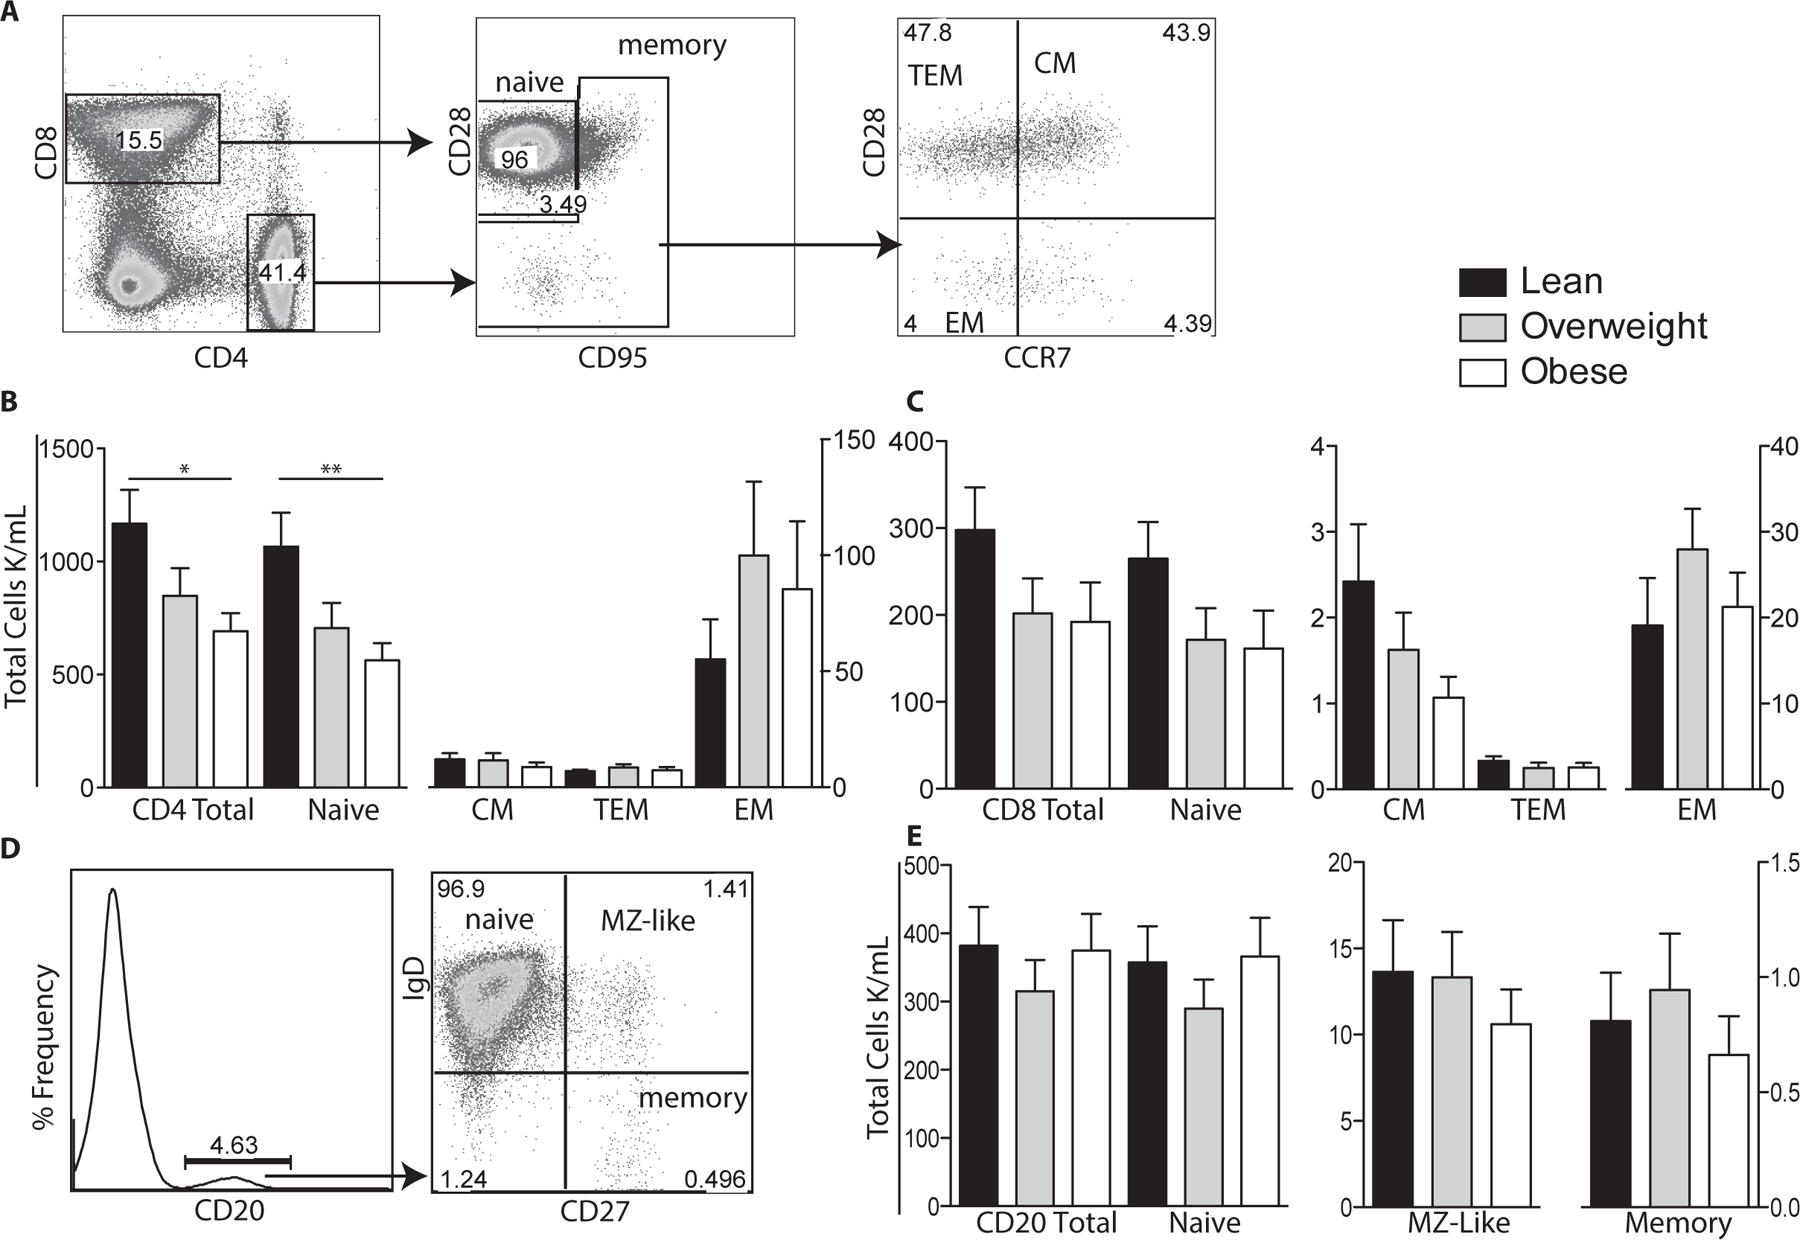
(A) Flow cytometry was used to delineate CD4 and CD8 T cells subsets: naïve, central (CM), effector (EM), and transitional effector memory (TEM) based on expression of CD28, CD95 and CCR7. (B) Numbers of total, naïve, CM, TEM and EM CD4 T cells per μl of cord blood were determined by multiplying subset frequency by the number of lymphocytes obtained by the hematology analyzer. (C) Number of total and CD8 T cell subsets were determined as described for CD4 T cells. (D) Flow cytometry was used to delineate total CD20+ B cells as well as naïve, marginal-zone like (MZ-like), and memory subsets. (E) Number of total CD20 B cells and subsets were determined as described for T cells. +/− SEM (n=11–14 UCB samples per group) *p≤0.05 **p≤0.01