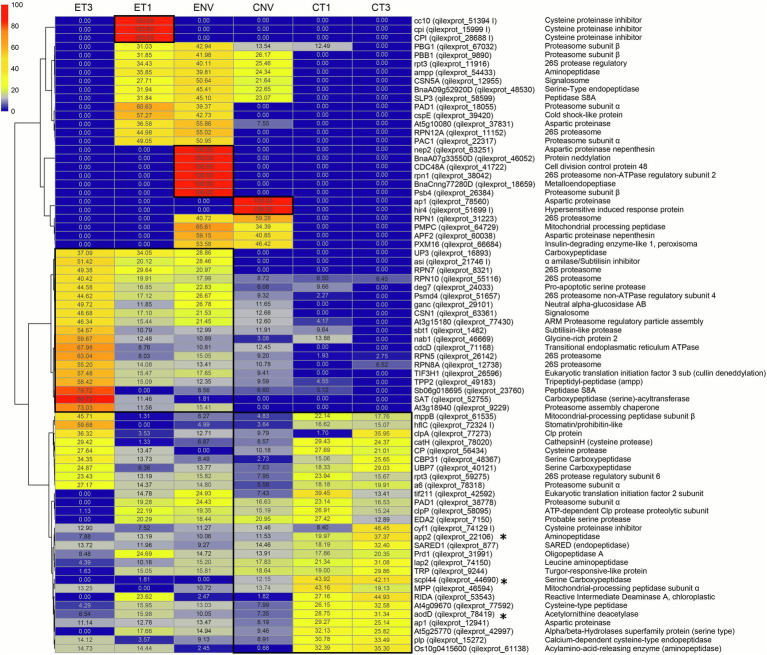
Figure 2.
Proteases and protease inhibitors heatmap included in the top300 loadings of PCA and Venn specific tissue/stage protease. E, embryo axis. C, cotyledon. NV: Nongerminated acorns after 4 weeks of germination. T1: mature acorns prior to germination. T3: germinated acorns when root tip size reached 6.5 mm. * proteases present in both the first and second PC. Numbers in each cell represent the normalized abundance of the proteins found in each treatment. This abundance is reflected in the color scale shown.

