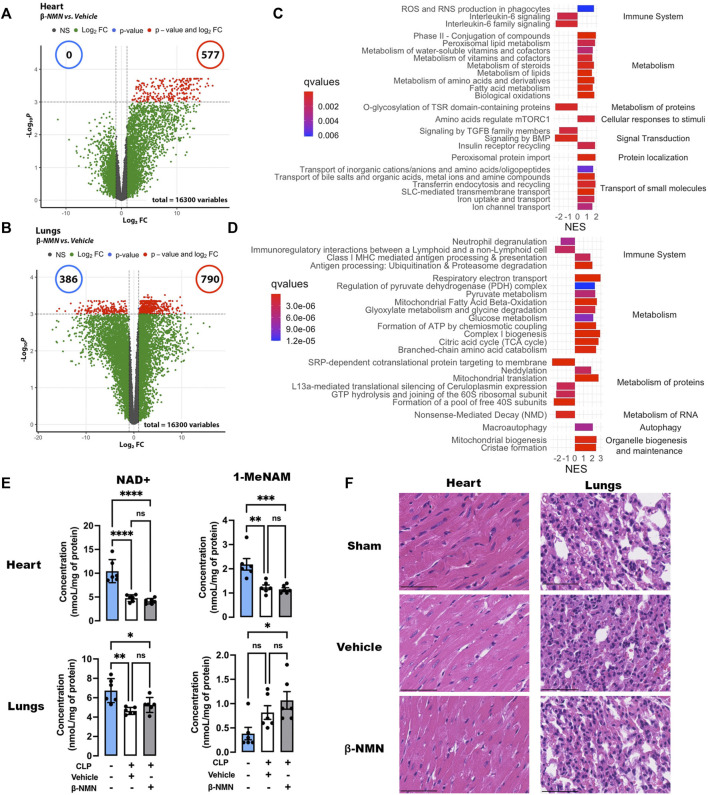
FIGURE 2.
Transcriptomic signatures, NAD+ and 1-MeNAM contents, and histology analysis of the heart and lungs of mice subjected to CLP. Hearts and lungs from vehicle and β-NMN mice were collected 24 h post CLP. (A,B) Volcano plots of the differentially expressed genes in the hearts (A) and lungs (B). Volcano plots display log2-transformed fold-changes (x-axis) vs. -log10 p-value (y-axis). The red dots represent the gene having fold-changes>2.0 and adjusted p-values<0.05 between the two groups. n = 3 for each group. (C,D) Enrichment plot of differentially expressed Reactome pathways in the hearts (C) and lungs (D). Normalized enrichment score (NES) reflects the up- (NES>0) and down- (NES<0)expressed pathways, and gradient color reflects the adjusted p-values<0.01; n = 3 for each group. (E) NAD+ and 1-MeNAM contents of hearts and lungs. Data are means ± SEM; n = 6 for each group; ns = non-significant; *p < 0.05; **p < 0.01; ***p < 0.001; ****p < 0.0001. (F) Representative H&E section (x20) of the hearts and lungs from the sham, vehicle, and β-NMN mice. There was no histopathological finding in any of the heart and lung sections examined. n = 3 for each group.

