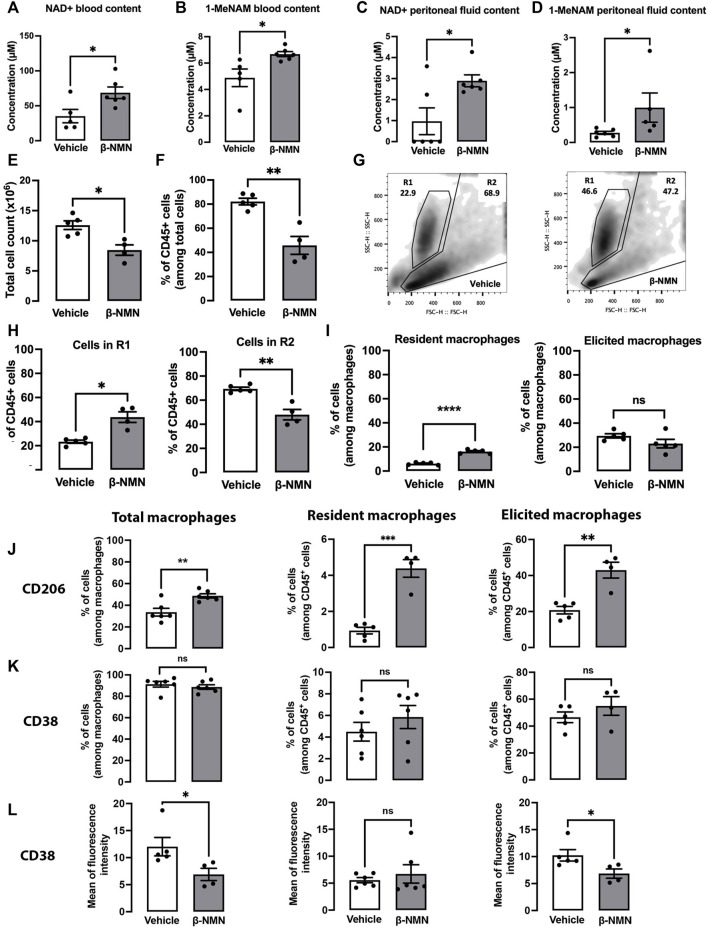
FIGURE 3.
Phenotypic characterization of peritoneal cells from mice subjected to TGC-induced peritonitis treated or not with β-NMN 3 days post TGC administration, blood, and peritoneal exudates from vehicle and β-NMN mice were collected. NAD+ and 1-MeNAM were dosed by UHPLC, and the peritoneal cells were characterized by flow cytometry. (A–D) NAD+ and 1-MeNAM contents of blood (A,B) and peritoneal fluid (C,D) of mice. (E) Total cell count in the peritoneal extrudates of mice. (F) Proportion of CD45 + cells found in the peritoneal exudates. Data were expressed as a percentage of total cells. (G) Representative dot-blot of forward scatter (FS) versus side scatter (SS) of peritoneal cell populations (R1 and R2) from vehicle- (left panel) and β-NMN-treated (right panel) mice. (H) Proportion of total peritoneal cell population in the R1 and R2 gates. Data were expressed as % of CD45 + cells. (I) Proportion of resident and elicited macrophages present in the CD45 + cell population. Resident and elicited macrophages were discriminated based on: F4/80+CD16/32+CD64loLFA1loMHC-IIlo; F4/80+CD16/32+CD64hiLFA1hiMHC-IIhi, respectively. The proportion of different subsets of macrophages was expressed as % of cells among total macrophages. (J–K) Proportion of macrophages and subpopulations of macrophages expressing CD206 (J) and CD38 (K) expressed as % of total macrophages and different subpopulations among the CD45 + cells. (L) Level of CD38 expression on macrophages and subpopulation of macrophages. Data were expressed as the mean of fluorescence intensity. Data are mean ± SEM; n = 4–6 for each group; ns = non-significant; *p < 0.05; **p < 0.01; ***p < 0.001; ****p < 0.0001 vs. vehicle.

