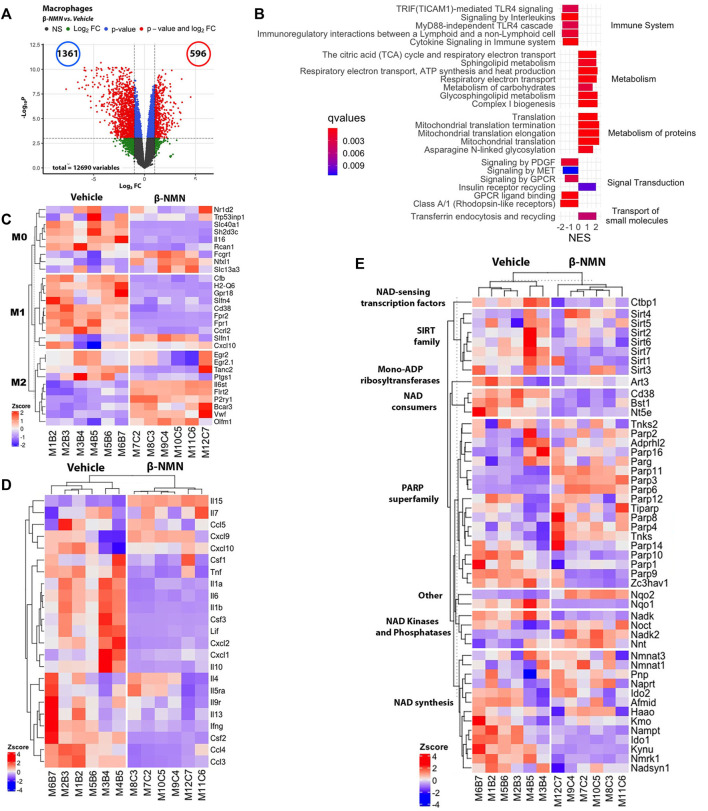
FIGURE 5.
Identification of differentially expressed genes in peritoneal macrophages following stimulation with E. coli in the TGC-induced peritonitis mouse model. Peritoneal macrophages were cultured in the presence of E. coli for 6 h and then submitted to transcriptomic analysis using de novo RNA sequencing. (A) Volcano plot of gene expression of peritoneal macrophages [plot of gene expression log2-transformed fold-changes (x-axis) vs. -log10 p-value (y-axis)]. The red dots represent the gene having fold-changes>2.0, and adjusted p-values<0.05 between β-NMN and vehicle groups. (B) Enrichment plot of differentially expressed Reactome pathways (β-NMN vs. vehicle) in peritoneal macrophages. Normalized enrichment score (NES) reflects the up- (NES>0) and down- (NES<0)expressed pathways, and gradient color reflects the adjusted p-values <0.01. (C–E) Hierarchical clustering heatmap of M0, M1, and M2 phenotype- (C), cytokine production- (D), and NAD + metabolism- (E) associated genes expressed by peritoneal macrophages. Red colors indicate Z-score>0 (up-regulation); blue colors indicate Z-score<0 (down-regulation); white color indicates Z-score = 0 (no difference). For all data n = 6 for each group.

