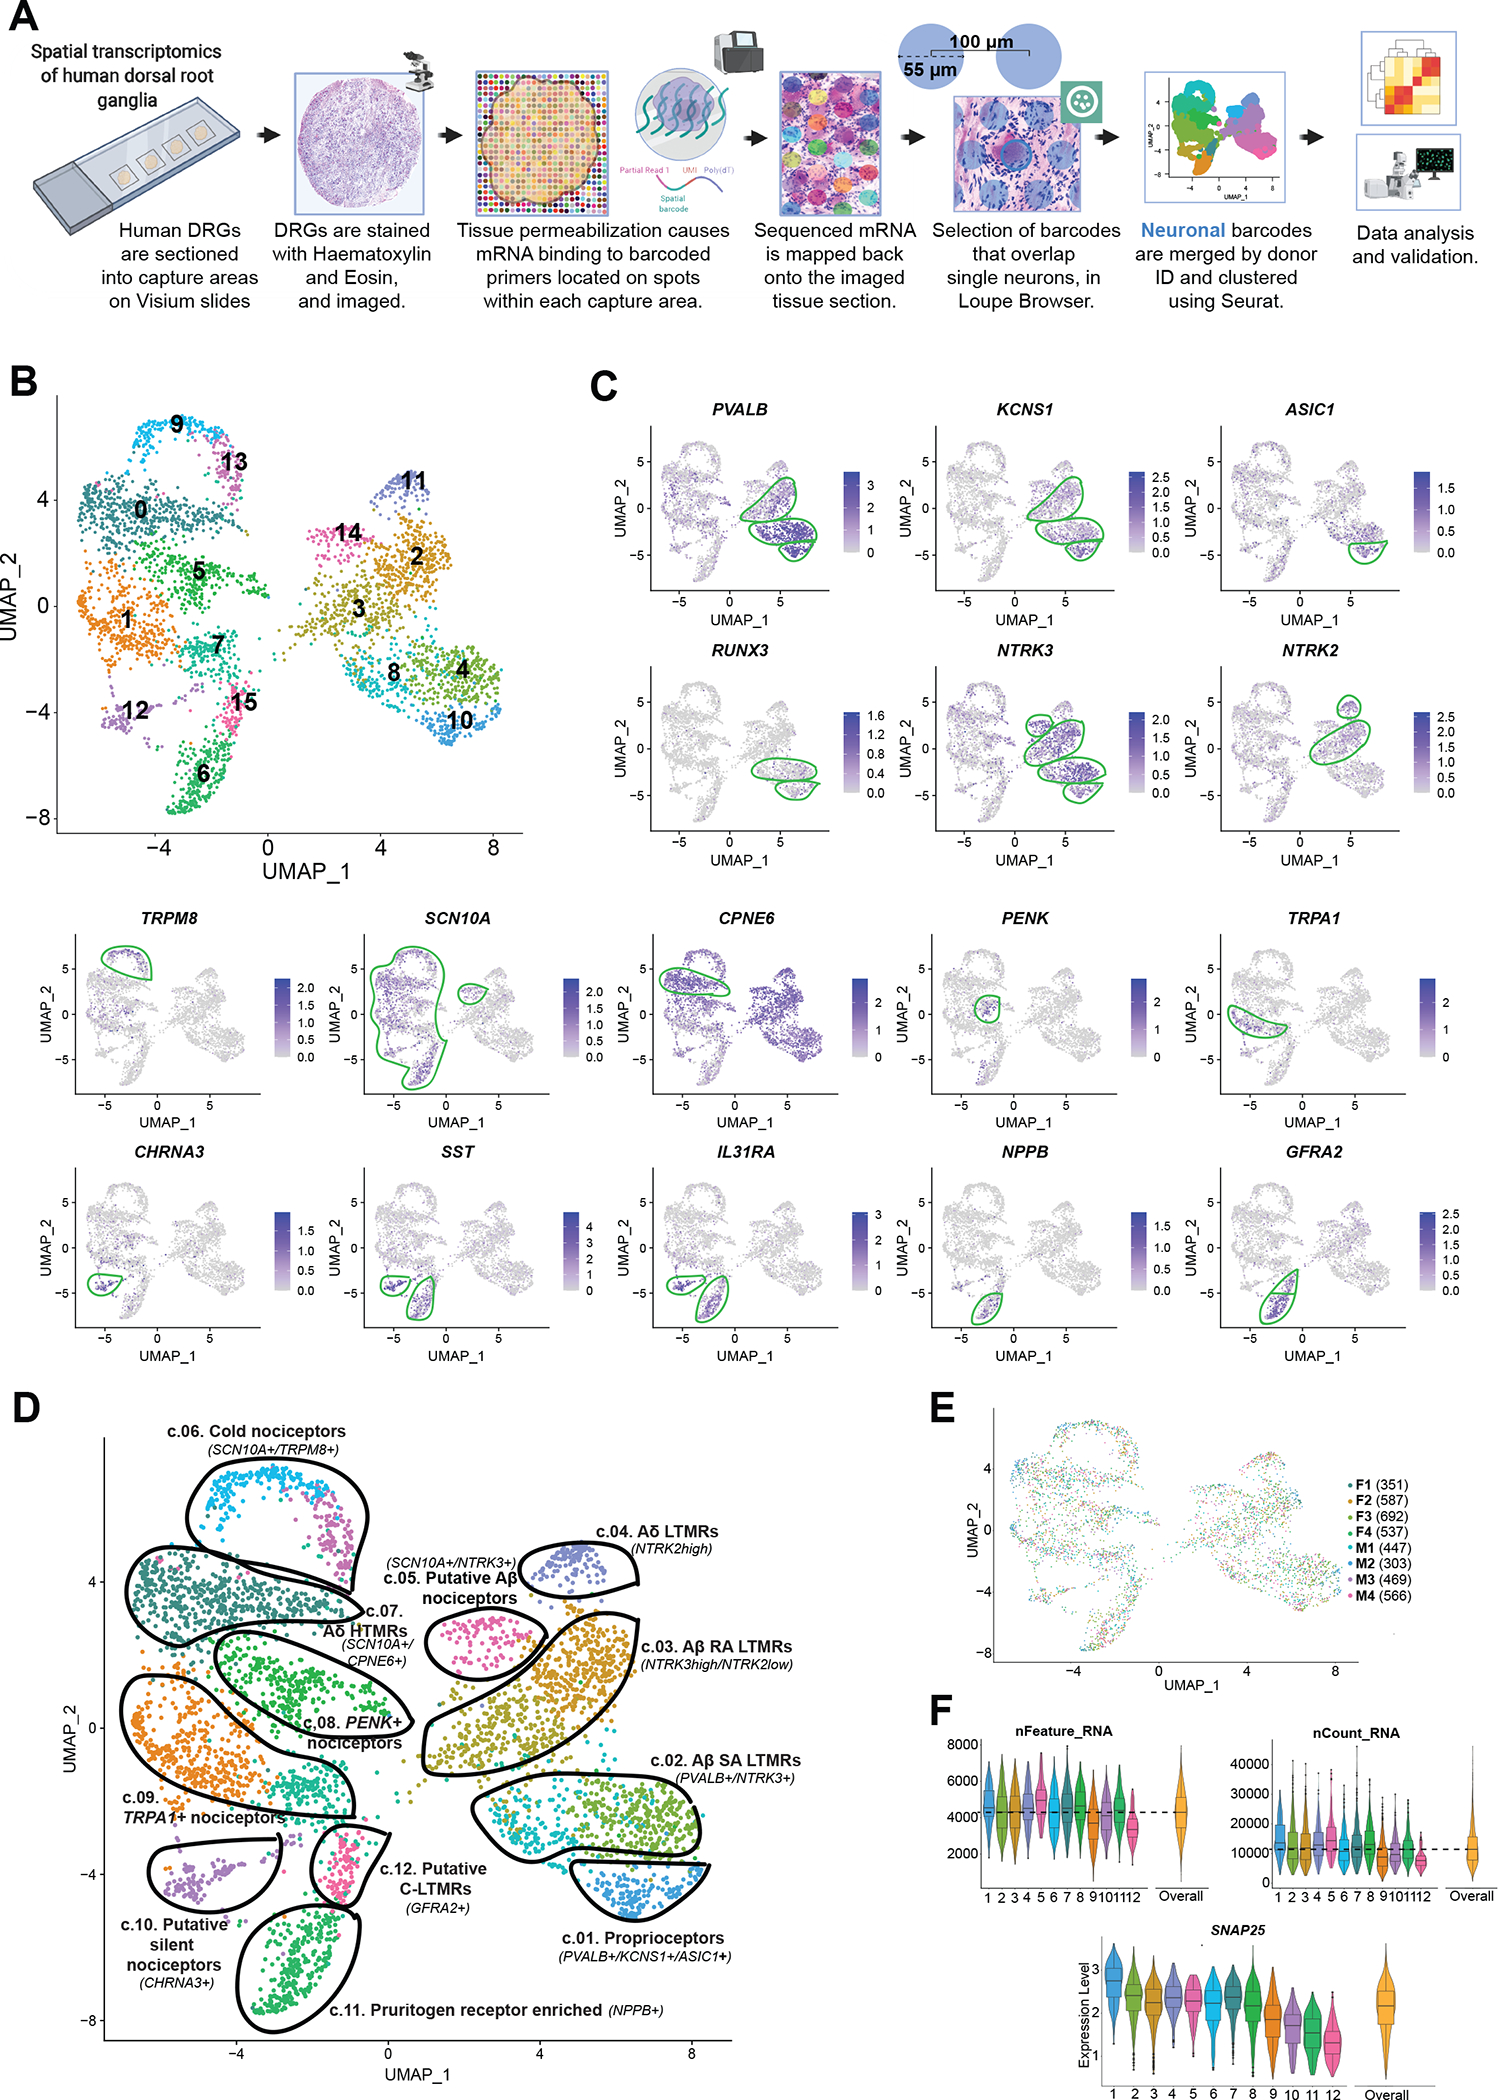
Fig. 1. Identification of neuronal subtypes in human DRG using spatial transcriptomics.

(A) Overview of the workflow and analysis. Neuronal barcodes (barcoded spots that overlap single neurons) were manually selected in Loupe Browser and clustered using Seurat package in R. (B) UMAP plot showing the 16 clusters generated by Seurat’s workflow. (C) UMAP plots of the expression of gene markers that were used to label neuronal clusters. (D) UMAP plot showing the 12 labeled human DRG neuronal clusters that were curated from the original 16 clusters, which are still shown with color coding matching (B). (E) UMAP plot shows the contribution of each donor for cluster formation. The number of barcodes per donor used for clustering is in parenthesis. (F) Violin plots show consistent distributions of the number of detected genes (nFeature_RNA), the counts of unique RNA molecules (nCount_RNA), and the average expression for the neuronal marker SNAP25 across clusters. The numbers on the x axis correspond to cluster numbers.
