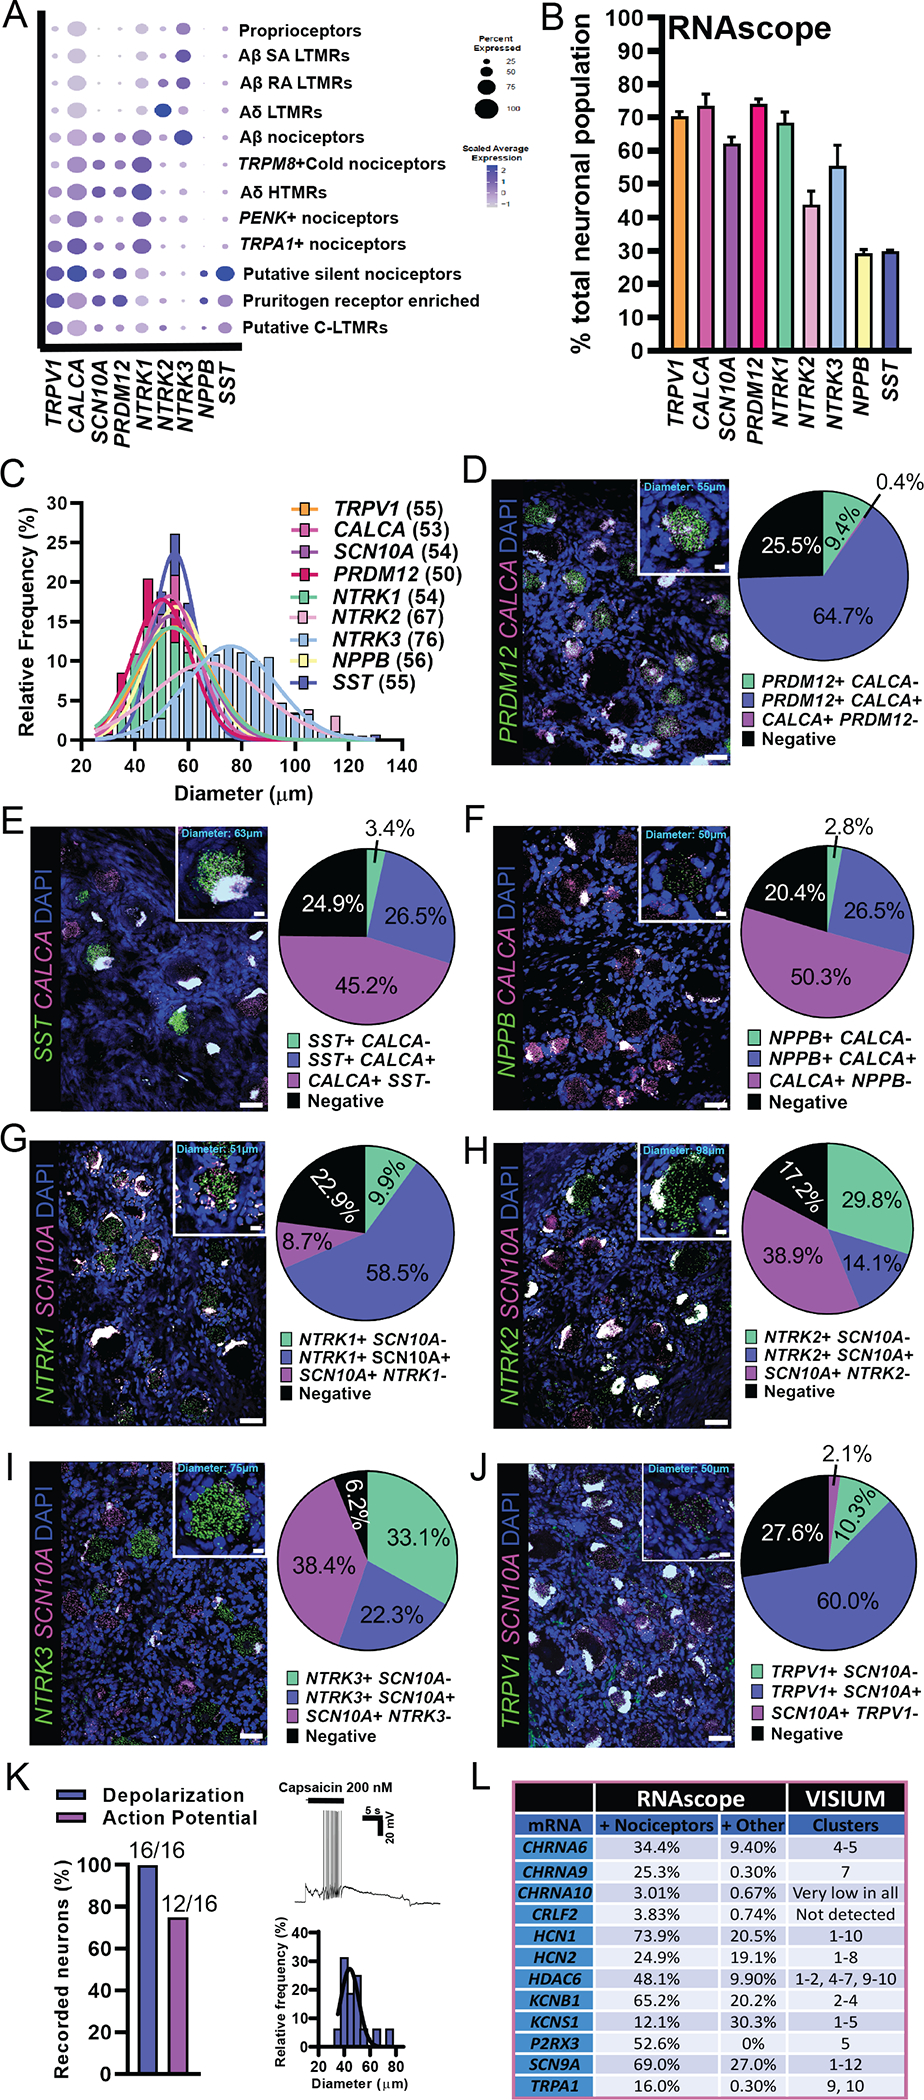
Fig. 3. RNAscope in situ hybridization and functional validation on human DRG.

(A) Visualization of Visium gene expression for markers that were used for RNAscope analysis. (B) Percentage of neurons expressing each target compared to the total neuronal population. (C) Size distribution of all target-positive neurons. Gaussian mean in micrometer diameter in parentheses. (D to J) Merged image for the target of interest (green) with a nociceptor marker (magenta) and DAPI (blue) is shown. Scale bars, 50 μm. Inset for each panel shows a blowup of a single neuron. Scale bars, 10 μm. Population distribution of each neuronal marker is shown in the pie chart. (K) The TRPV1 agonist, capsaicin (200 nM), was applied to small-diameter human DRG neurons in vitro causing depolarization (100%) and action potential firing (75%). (L) RNAscope data are summarized from (8) and compared to findings from Visium sequencing. The neuronal cluster for each target is listed. Clusters: 1, proprioceptors; 2, Aβ SA LTMR; 3, Aβ RA LTMR; 4, Aδ LTMR; 5, Aβ nociceptors; 6, TRPM8+ cold nociceptors; 7, Aδ HTMR; 8, PENK+ nociceptors; 9, TRPA1+ nociceptors; 10, putative silent nociceptors; 11, pruritogen receptor enriched; 12, putative C-LTMRs.
