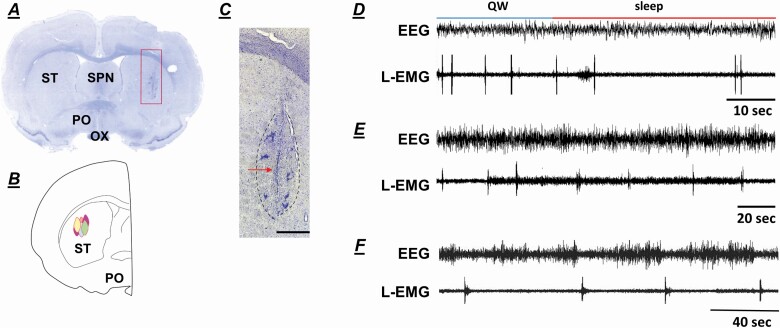
Figure 2.
(A) Photomicrographs showing the lesion site in the striatum. (B) Reconstructed histology showing the NMDA-lesioned sites in the striatum. (C) Higher magnification photomicrograph, taken of the square area shown in (A), showing the lesion area circled with black dots. The arrow shown in (C) indicates the injection needle tract. Brain tissue was stained with cresyl violet. (D) and (E) example of periodic leg movements (PLM) in quiet wake (QW; D) and in sleep (E) observed in the striatal-lesioned wild-type rats. (F) example of PLM recorded in wild-type rat. EEG: electroencephalogram, L-EMG: leg electromyogram, OX: optic tract, PO: preoptic area, SPN: septal nucleus, ST: striatum. Calibration (C) 90 μL.

