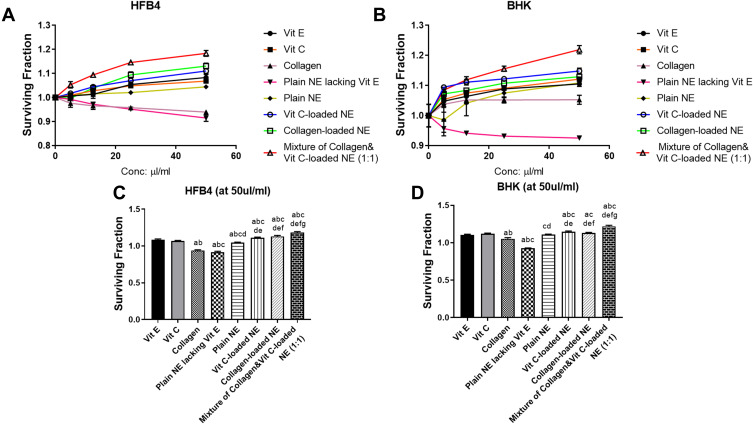
Figure 5.
Surviving fraction after applying the different treatments (Vit E, Vit C, collagen, plain NE lacking Vit E, Plain NE, Vit C-loaded NE, collagen-loaded NE, and a mixture of collagen and Vit C-loaded NEs) for 48 h on (A) HFB4 cells, (B) BHK cells, (C) HFB4 cells after applying the treatments at the highest concentration (50 µL/mL), and (D) BHK cells after applying the treatments at the highest concentration (50 µL/mL). The actual data represent the mean ± SD of three separate experiments performed in duplicates. Results were analyzed for statistical significance by one-way analysis of variance (ANOVA) followed by Tukey multiple comparison post-hoc test. aSignificant difference from Vit E, bSignificant difference from Vit C, cSignificant difference from collagen, dSignificant difference from Plain NE lacking Vit E, eSignificant difference from Plain NE, fSignificant difference from Vit C-loaded NE, and gSignificant difference from collagen-loaded NE (p<0.05).

