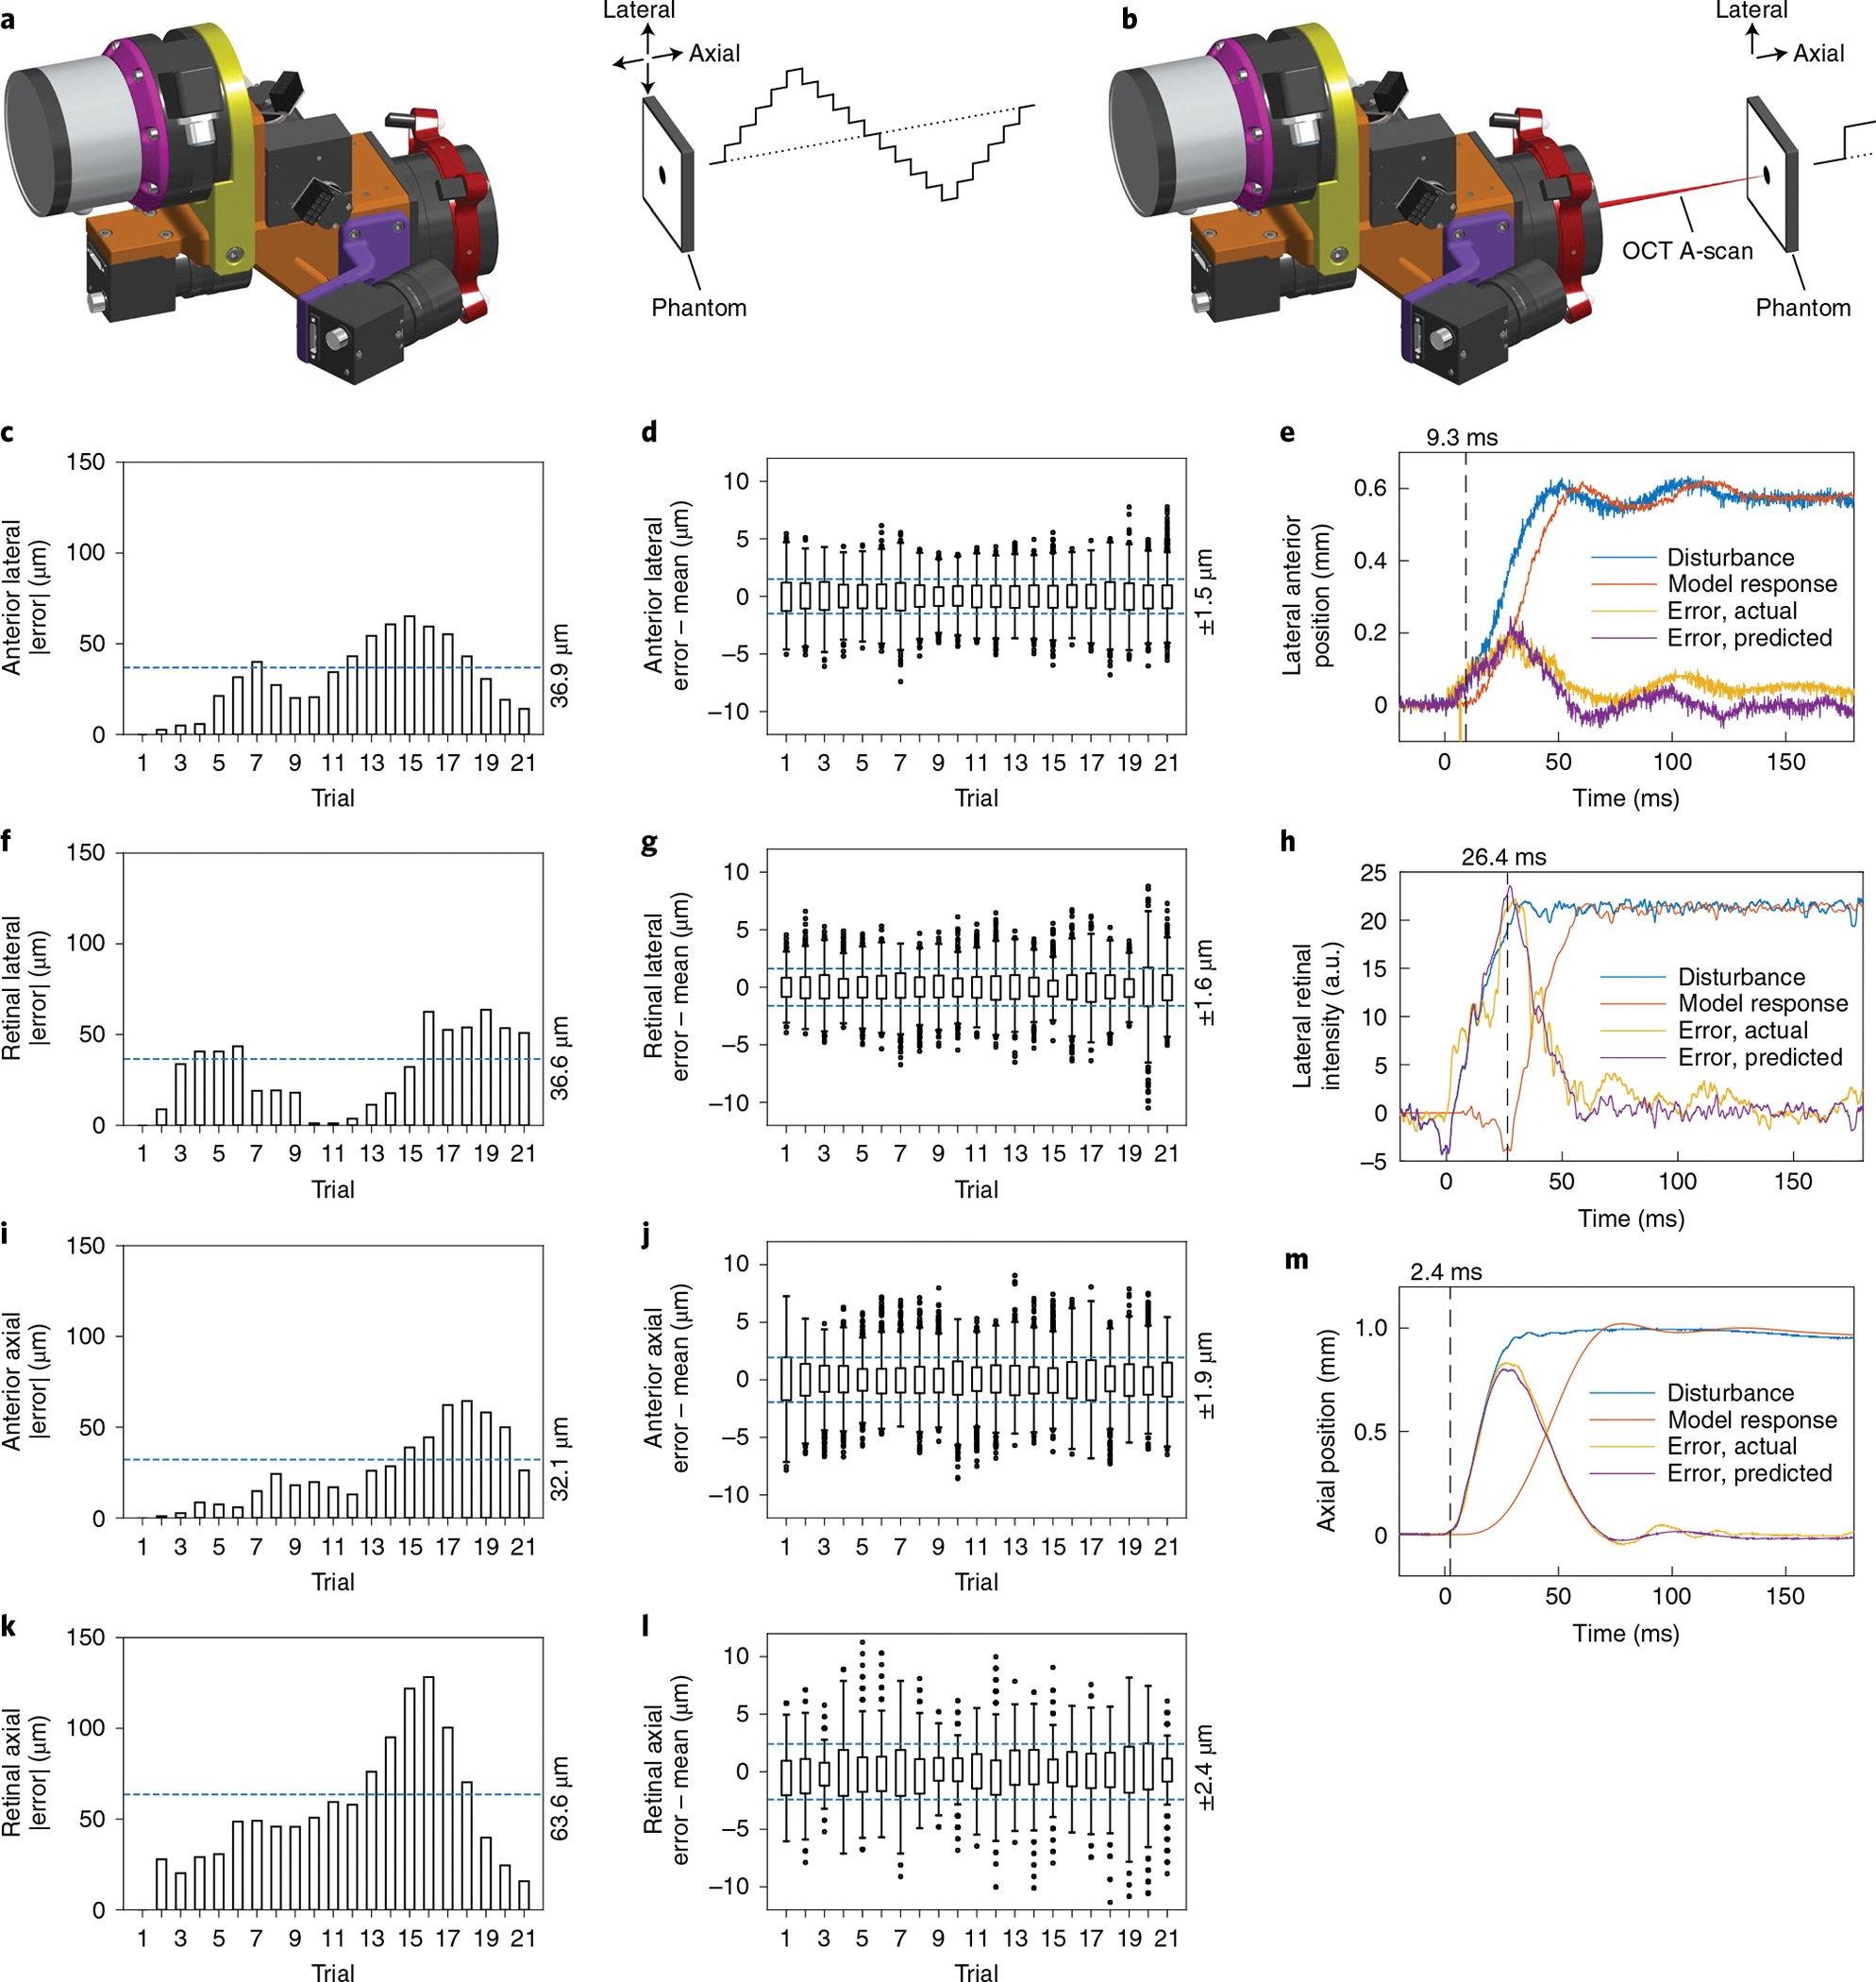
Fig. 2 |. Accuracy, precision and transient response for anterior and retinal active-tracking scan heads.

a, Setup for accuracy and precision measurements, in which the stationary tracking cameras (left) measure phantom position through a sequence of lateral and axial 1 mm steps as illustrated (right). b, Setup for latency measurements, in which the stationary scan head actively tracked the phantom to maintain the OCT A-scan position during single lateral 2 mm and axial 1 mm steps as shown. c, Absolute mean error for anterior lateral steps, indicating an accuracy of 36.9 μm (n ≥ 1,369 samples per trial). d, Position distribution for anterior lateral steps with per-step mean removed, indicating a precision of 1.5 μm (n ≥ 1,369 samples per trial). e, Anterior lateral step disturbance (blue) from laterally stepping a tilted phantom with resultant galvanometer tracking error (yellow). The time-delayed model response (orange) optimally recapitulates the tracking error (purple) at 9.3 ms latency. f, Absolute mean error for retinal lateral steps, indicating an accuracy of 36.6 μm (n ≥ 637 samples per trial). g, Position distribution for retinal lateral steps with per-step mean removed, indicating a precision of 1.6 μm (n ≥ 637 samples per trial). h, Retinal lateral step disturbance (blue) from laterally stepping an occluded phantom with resultant FSM tracking error (yellow). The time-delayed model response (orange) optimally recapitulates the tracking error (purple) at 26.4 ms latency. a.u., arbitrary units. i, Absolute mean error for anterior axial steps, indicating an accuracy of 32.1 μm (n ≥ 1,295 samples per trial). j, Position distribution for anterior axial steps with per-step mean removed, indicating a precision of 1.9 μm (n ≥ 1,295 samples per trial). k, Absolute mean error for retinal axial steps, indicating an accuracy of 63.6 μm (n ≥ 700 samples per trial). l, Position distribution for retinal axial steps with per-step mean removed, indicating a precision of 2.4 μm (n ≥ 700 samples per trial). m, Anterior and retinal axial step disturbance (blue) from axially stepping a phantom with resultant VCM tracking error (yellow). The time-delayed model response (orange) optimally recapitulates the tracking error (purple) at 2.4 ms latency. For all box plots, centre lines indicate the median, boxes extend between the lower and upper quartiles, whiskers are 1.5× of interquartile range and points indicate outliers.
