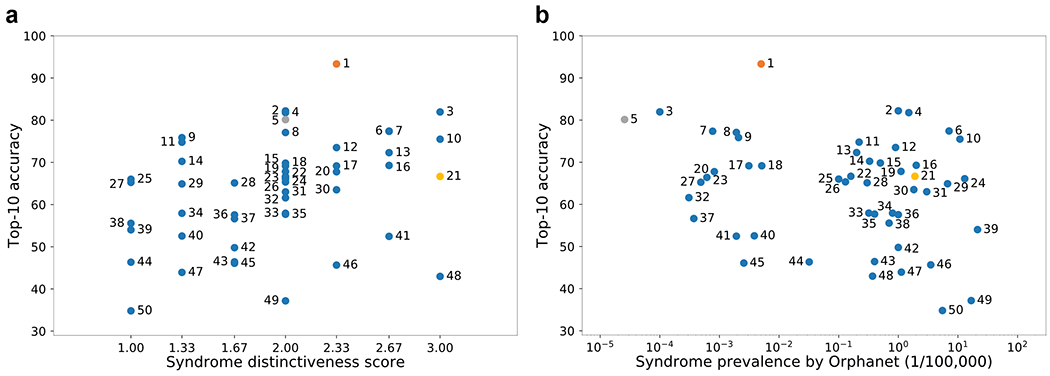
Figure 5: Correlation among syndrome prevalence, distinctiveness score, and top-10 accuracy.

a, Distribution of top-10 accuracy and distinctiveness score. The Spearman rank correlation coefficient was 0.400 (P = 0.004). b, Distribution of top-10 accuracy and prevalence. The Spearman rank correlation coefficient was −0.217 (P = 0.130) The details of each syndrome can be found in Supplementary Table 6 using the syndrome ID shown in the figure; syndrome 5 is Schuurs-Hoeijmakers syndrome. The y-axis shows the average top-10 accuracy of the experiments over 100 iterations.
