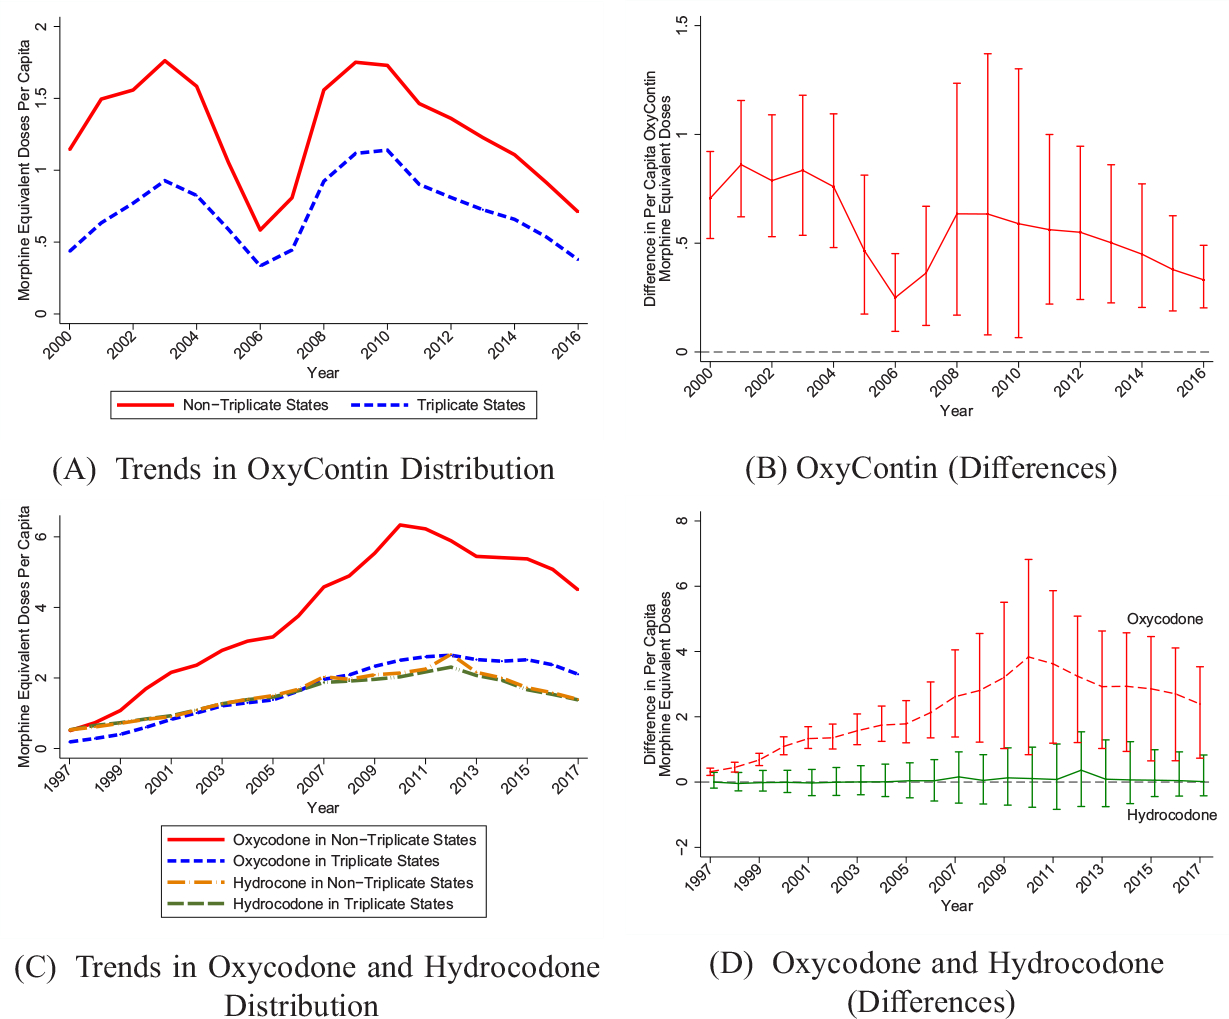
Figure III.

Differences in Opioid Distribution by Triplicate Status
We use ARCOS data, converted to morphine equivalent doses. Panel A shows raw (per capita) means for OxyContin. Panel C shows raw (per capita) means for oxycodone and hydrocodone in separate trend lines. Estimates in Panels B and D represent cross-sectional differences corresponding to Panels A and C, respectively. 95% confidence intervals are generated using a clustered (at state) wild bootstrap. All figures are population weighted.
