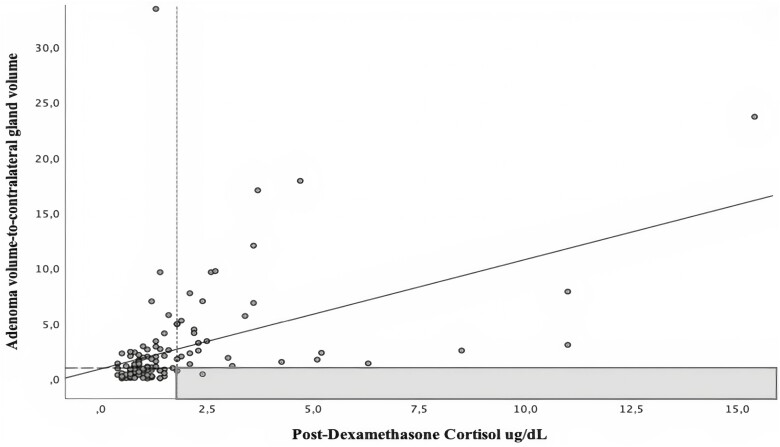
Figure 2.
Correlation of post-dexamethasone cortisol values with proposed volumetric ratio. Scatterplot showing Pearson correlation of post-dexamethasone cortisol with adenoma volume/contralateral gland volume ratio. Vertical dotted line (x-axis) represents post-dexamethasone cortisol of 1.8 ug/dL (threshold for possible autonomous cortisol secretion). Horizontal dashed line (y-axis) represents adenoma volume/contralateral gland volume ratio equal to 1. The gray colored area represents the most sensitive threshold to exclude (rule-out) autonomous cortisol secretion.

