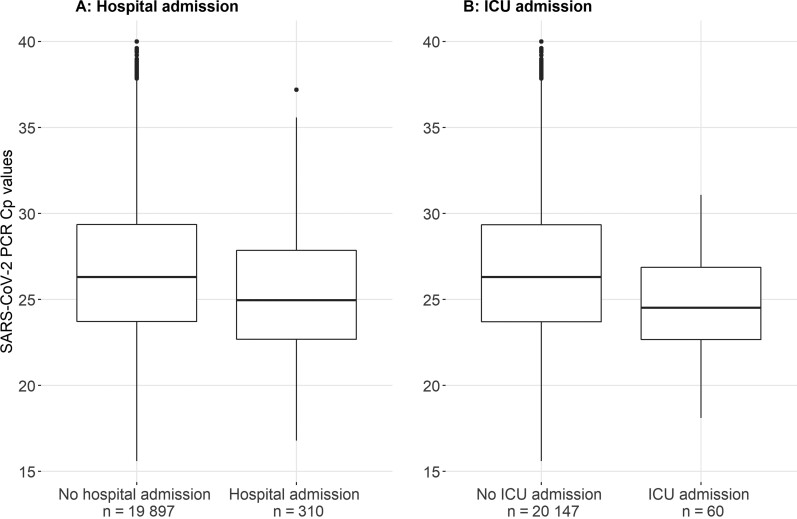
Figure 1.
Severe acute respiratory syndrome coronavirus 2 (SARS-CoV-2) viral load distribution of 20 207 unique patients who were tested at a public health testing facility. Data on SARS-CoV-2 viral load distribution are presented for patients who were (n = 310) or were not (n = 19 897) admitted to hospital within 30 days after their initial SARS-CoV-2 reverse-transcription polymerase chain reaction (RT-PCR) test (A), and for patients who were (n = 60) or were not (n = 20 147) admitted to the intensive care unit (ICU) within 30 days after their initial SARS-CoV-2 RT-PCR test (B). Data are presented as box-and-whisker plots with the central box covering the interquartile range with the median crossing point (Cp) value indicated by the line within the box. The whiskers extend to the minimum and maximum values within 1.5 interquartile ranges of the quartiles; more extreme values are plotted individually.

