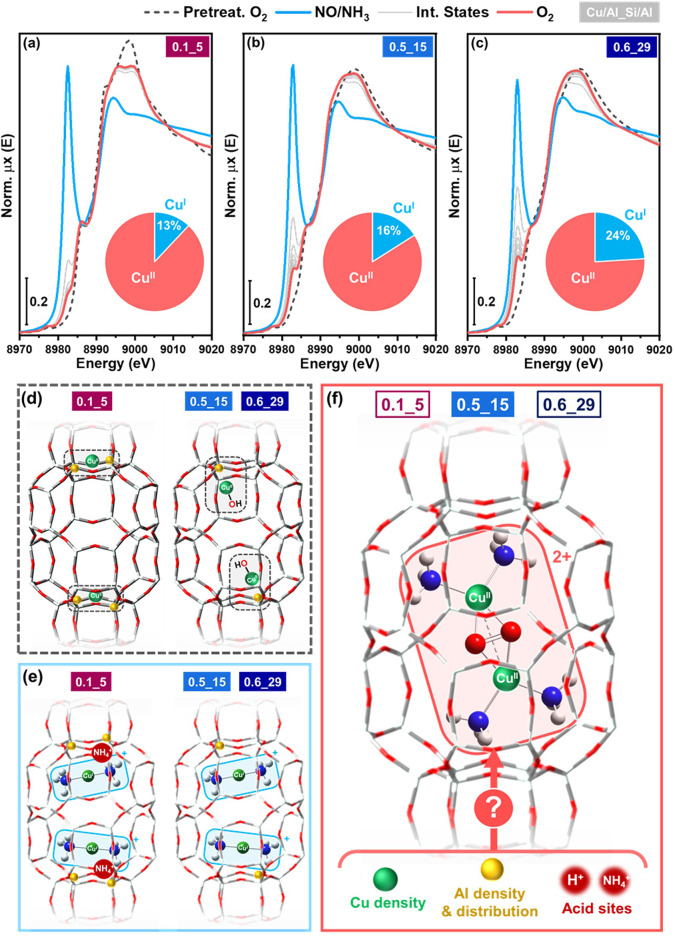
Figure 1.
In situ Cu K-edge XANES for (a) 0.1_5, (b) 0.5_15, and (c) 0.6_29 Cu-CHA catalysts collected at 200 °C after pretreatment in O2, at the end of the reduction step, during and after the oxidation step. Pie charts illustrate CuI/CuII percentages evaluated by XANES LCF at the end of the oxidation step for each catalyst; under the adopted experimental conditions, CuI and CuII correspond to [CuI(NH3)2]+ and [Cu2(NH3)4O2]2+ complexes, respectively. (d–f) Pictorial representation of the main Cu-species expected at each step as a function of the catalyst composition, with open questions on parameters influencing coordination motif in [Cu2(NH3)4O2]2+ complexes in part (f).

