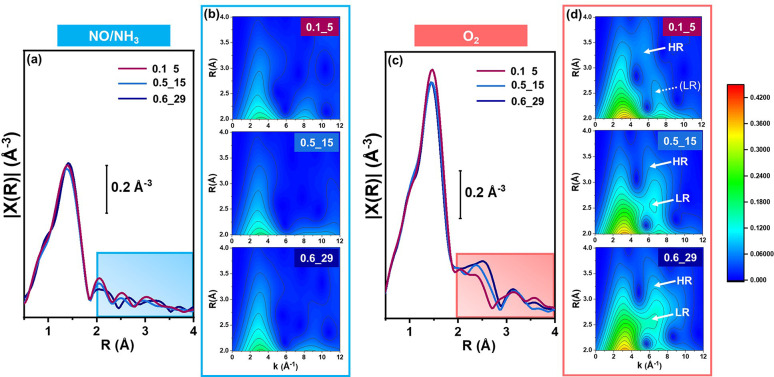
Figure 3.
Snapshots of local coordination environment of Cu ions by EXAFS, comparing 0.1_5, 0.5_15 and 0.6_29 at the end of the (a, b) reduction and (c, d) oxidation steps. (a, c) Magnitude of FT-EXAFS spectra, obtained by Fourier transforming k2χ(k) spectra in the 2.4–12.0 Å–1 range. (b, d) Corresponding EXAFS-WT maps, magnified in the 2–4 Å range and plotted using a common intensity scale. Low-R (LR) and high-R (HR) features in the k-range diagnostic of Cu–Cu scattering are highlighted by white arrows in part (d).

