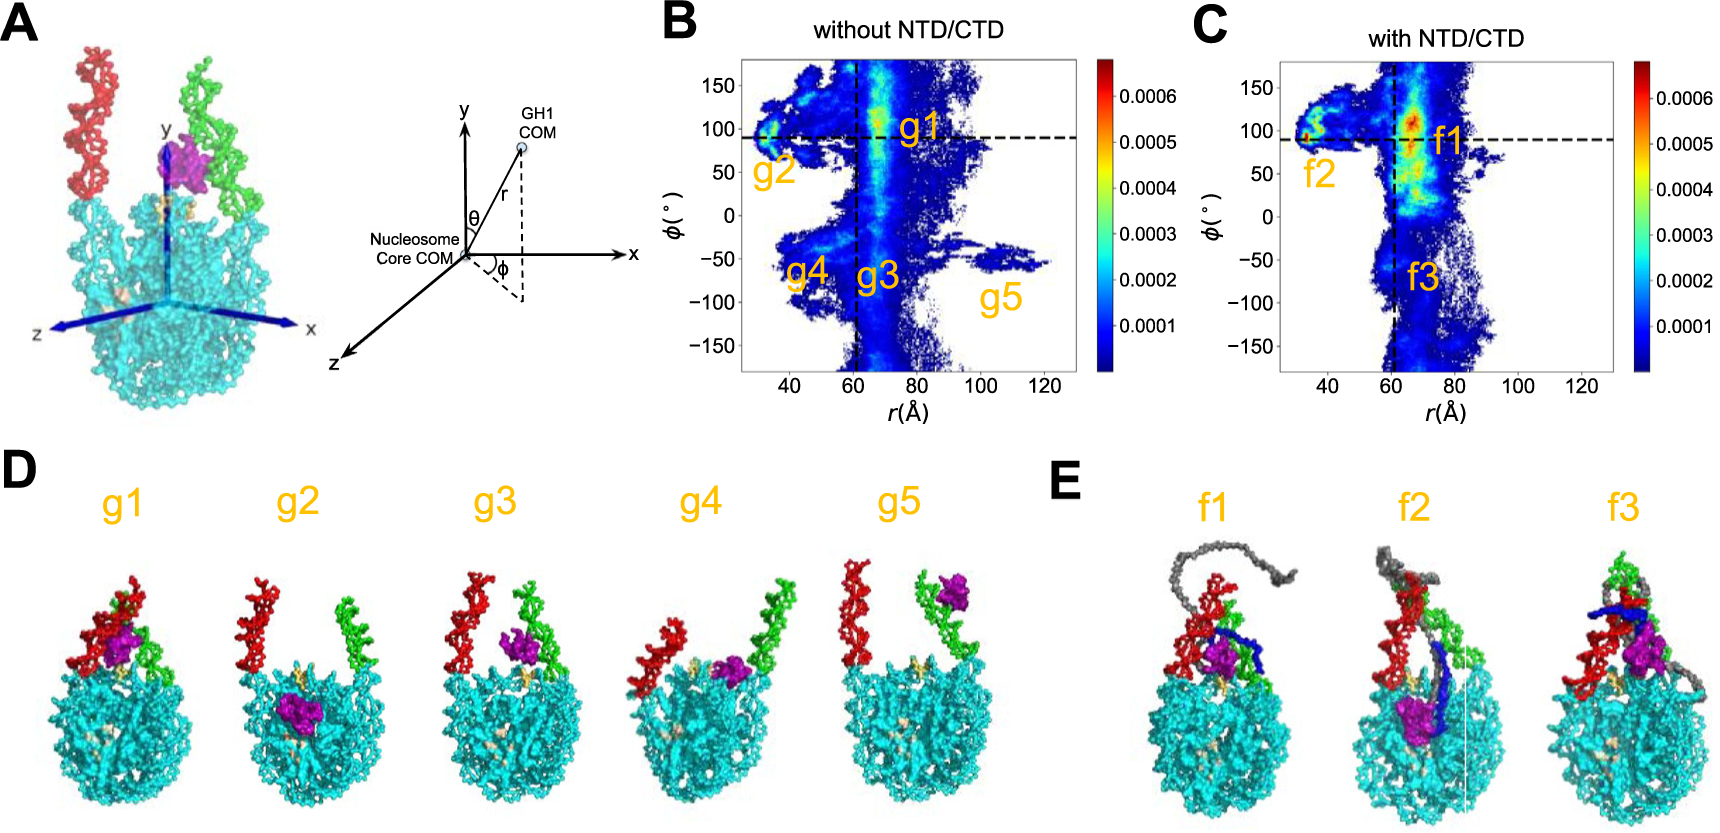
Figure 3.

GH1-nucleosome relative conformations. (A) Definition of the 3D reference coordinate system and GH1 COM spherical coordinates (r, θ, ϕ). The 2D histogram of (ϕ, r) for GH1-nucleosome (B) and full-length H1-nucleosome (C) are shown as heat maps. The color bar from blue to red indicates a probability from low to high. The ϕ and r values at the beginning of simulations are labeled as black dashed lines. The representative snapshots of all the major basins labeled in (B-C) are shown in (D) and (E). The color code for different parts of molecules is the same as Figure 1, except for the region in light brown for the histone acidic patch.
