Figure 5.

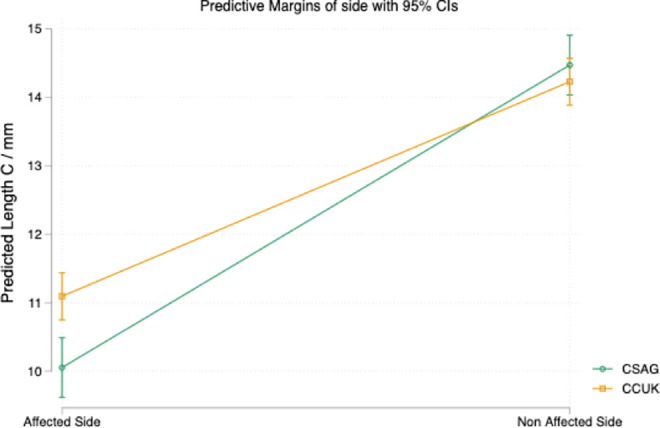
Margin plot illustrating the interaction between the CSAG and CCUK cohorts on the lesser side E measurement (LE) and greater side E measurement (GE).

Margin plot illustrating the interaction between the CSAG and CCUK cohorts on the lesser side E measurement (LE) and greater side E measurement (GE).