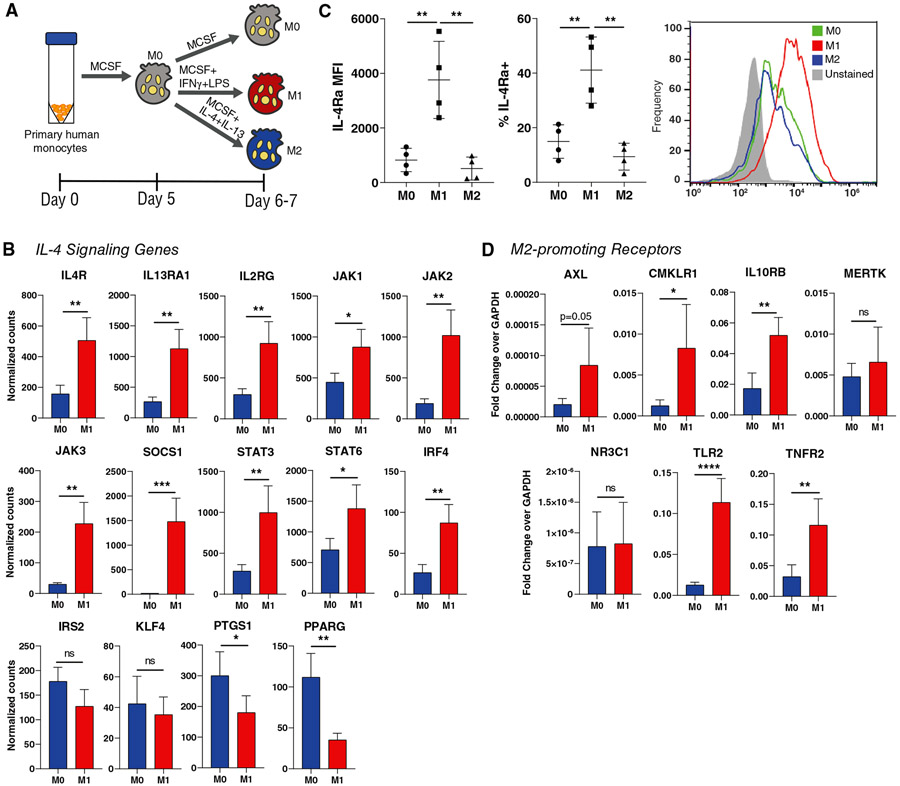
FIGURE 1. M0 and M1 Mϕ expression of M2-promoting receptors.
(A) Polarization of unactivated (M0) Mϕs to the M1 or M2 phenotypes. (B) NanoString counts of genes associated with the IL-4 signaling pathway, using cells collected 24 hours after the addition of polarizing cytokines (day 6). Data are represented as mean ± SD. Unpaired t-test, n = 4 donors, *P < 0.05, **P < 0.01, ***P < 0.001. (C) Flow cytometric analysis of IL-4Rα expression, using cells collected at day 7. Data are represented as mean ± SD. One-way ANOVA with Tukey’s post hoc, n = 4 donors, **P < 0.01. (D) qRT-PCR analysis of receptors associated with promoting an M2-like Mϕ phenotype, using cells collected at day 7. Data are represented as mean ± SD. Unpaired t-test, n = 3-4 donors, *P < 0.05, **P < 0.01, ****P < 0.000

