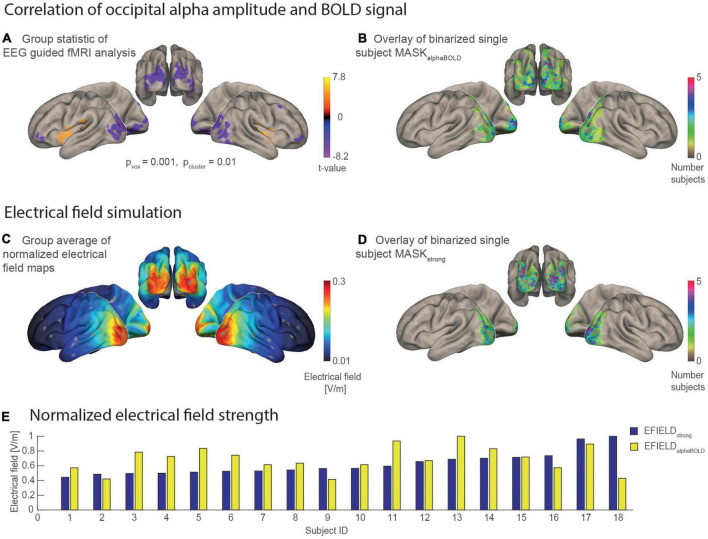
FIGURE 4.
Statistical maps and masks resulting from the EEG guided fMRI analysis and the electrical field simulations mapped on the MNI brain. (A) Result of the group statistic calculated for the EEG-guided fMRI analysis shows the spatial distribution of positive and negative correlations between alpha amplitude and BOLD [n = 18, p(voxel level) = 0.001, p(cluster, fdr corrected) = 0.01]. (B) Overlay of 18 binary single subject masks, each covering 1,000 occipital voxels with the individually highest alpha BOLD correlation (t-value). The color scale codes the number of individual masks that cover the same region. (C) Grand average of the individual electrical field simulations (n = 18). (D) Overlay of 18 binary single subject masks that each cover a region with the 1,000 highest electrical field values. (E) Bar plot for the electrical field strength values of each subject that was determined as an average of simulated electrical field values covered by a subject-specific mask. EFIELDstrong (blue) is sorted in ascending order.

