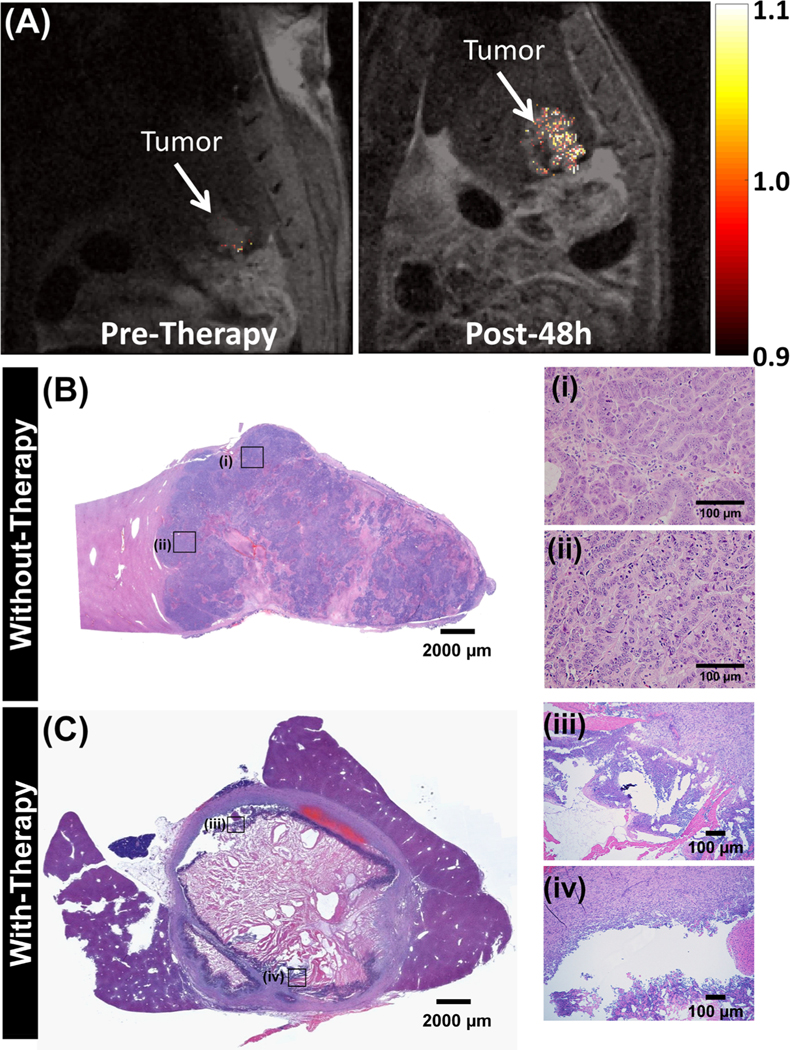
Figure 8.
In vivo hepatic portal vein T1/T2 MR imaging at pre- and post-therapy. (A) Representative 9.4 T T1-weighted coronal MR images of the tumor contrast in CRLM tumor-bearing rats overlaid onto T2-weighted MR images for pre- and post-48 h therapy. Enhancement in mean tumor T1 contrast at pre- and post-48 h calculated for n = 3 rats. Representative H&E images of tumors in (B) untreated animals. The images (i and ii) on the right side show the enlarged rectangular region on the left panel. (C) TNPs and laser, where a large necrotic region is visible in the center of the tumor, and peripheral regions are characterized by apoptotic cells. The images (iii and iv) on the right side show the enlarged rectangular region on the left panel, where the disintegrated tumor region is clearly visible.

