Abstract
Background:
Endometrial cancer is the most common gynecological cancer among women in developed countries. Sono-elastography is an extended ultrasonographic technique that has been shown to be useful in a wide range of conditions ranging from breast, prostate, and thyroid nodules to chronic liver disease and musculoskeletal conditions. The aim of this study is to compare the sonoelastographic features of endometrial malignancy and normal endometrium.
Methods:
This case–control observational study was conducted at a single institution. Participants with histologically proven endometrial cancer according to the results from microcurettage or hysteroscopic biopsy and scheduled for total hysterectomy were included as cases, while asymptomatic women scheduled for routine screening ultrasound examination were recruited as controls. Both cases and controls underwent conventional B-mode transvaginal ultrasonography and strain elastography. Demographic, ultrasonographic, and histopathologic findings were analyzed.
Results:
A total of 29 endometrial cancer patients (cases) and 28 normal females (controls) were included in the analysis. There was no significant difference in the mean age between the two groups, but the mean body weight was significantly higher in the case group (P < 0.001). The strain ratio and elastographic thickness ratio of the endometrium were statistically significantly different between the case and the control group (P ≤ 0.05) due to increased endometrial stiffness in cancer patients as compared to the normal group.
Conclusion:
Our results suggest that endometrial cancer can result in increased stiffness that is detectable by transvaginal sonoelastography. Sonoelastography may serve as an adjunct to conventional ultrasound in evaluating the endometrium of women with abnormal uterine bleeding.
Keywords: Elastography, endometrial cancer, transvaginal ultrasonography
INTRODUCTION
Endometrial cancer is the most common gynecological malignancy among women in developed countries. Worldwide, it ranks as the 6th most common malignancy among women.[1] In Singapore, the incidence of endometrial cancer has increased significantly with an average annual rate of increase at 3.1% over a 50-year period from 1968 to 2017,[2] overtaking cervical cancer as the most common gynecological malignancy. Today, it ranks as the 4th most common malignancy among women after breast, colorectal, and lung cancers. The risk factors for endometrial cancer include unopposed exposure to estrogen or prolonged exposure to estrogen, obesity, increasing age, diabetes, and hereditary nonpolyposis colorectal cancer.[1,3,4]
The most common presentation for endometrial malignancy is postmenopausal bleeding. However, in premenopausal women, it may manifest as menorrhagia, metromenorrhagia, or intermenstrual bleeding, symptoms that may also be caused by other gynecological conditions such as uterine fibroids and adenomyosis.
Transvaginal ultrasound is the main imaging modality to assess for endometrial pathology in women with abnormal vaginal bleeding. Endometrial thickness, vascularity, and heterogeneity in the appearance are used as the ultrasonographic indicators of pathology.[5,6,7] More recently, the assessment of tissue stiffness using sono-elastography has been found to be efficacious in a number of applications in various organ tissues.[8,9,10] It is an established application for assessing hepatic and breast lesions. In contrast, the application of elastography in gynecological ultrasound is less well established. There are two main ultrasound elastographic techniques used in conjunction with conventional ultrasound, namely, strain and shear-wave elastography. Currently, most machines are equipped to perform transvaginal strain elastography. The technique assesses tissue elasticity by measuring the degree of distortion by the external compression and decompression of soft tissues.[11] Pathological changes in tissues may affect their elasticity and such changes may be used to distinguish diseased from the normal tissues. Increased tissue stiffness has been found to be associated with malignant lesions.[12]
The aim of this study is to assess the features of transvaginal sono-elastography in endometrial cancer in comparison to normal endometrium.
MATERIALS AND METHODS
The study was reviewed and approved by the Singhealth Centralized Institutional Review Board on August 4, 2015 (Ref number 2015/2451). Written informed consent was obtained from all study participants.
This case–control study was conducted at a single institution, KK Women's and Children's Hospital, Singapore, from November 2015 to October 2018 in women who attended the ultrasound imaging service. The inclusion criteria were age of at least 18 years, ability to comprehend the study constraints, provide informed consent and undergo transvaginal ultrasound. The cases were randomly recruited patients with histologically proven endometrial cancer according to results from microcurettage or hysteroscopic biopsy and scheduled for total hysterectomy within a month of the ultrasound. Patients who would not provide consent, did not have subsequent surgery at the hospital, or who were unable to tolerate transvaginal scanning were excluded from the study. Controls were randomly recruited asymptomatic women who attended the clinic for routine screening ultrasound examination and had normal ultrasound findings.
Demographic and clinical data were collected through a routine questionnaire, including age, weight, menopausal status, and symptoms. Transvaginal ultrasonography and real-time transvaginal sono-elastography were performed on all patients within a month before the surgery. These findings were correlated to the histopathological findings from the hysterectomy. All ultrasound examinations were performed using the Philips iU22 (Philips Medical Systems, Bothell, WA, USA) ultrasound system and a 4–9 MHz endovaginal transducer. A select group of three sonographers, each with more than 5 years of experience in gynecological ultrasound were trained to acquire the elastography images in a standardised method before the commencement of the study. A standardized preprogrammed scanning protocol with optimized B-mode and elastography scanning parameters were used as per the recommended guidelines to ensure consistency of the results obtained.[13,14] The examination was performed using a bimanual compression method. External transabdominal compression was applied to limit the mobility of the uterus. The second compression was a steady high frequency, low intensity compression applied infero-superiorly on the uterus using the vaginal transducer, similar to the dynamic steady state technique described by Stoelinga et al.[15] The intensity of the pressure should not result in a visible displacement of the uterus on real-time observation and the pressure indicator [Figure 1] was maintained at a steady level of approximately 70% that we found to be optimal for displaying the endometrium using the specified ultrasound unit.
Figure 1.
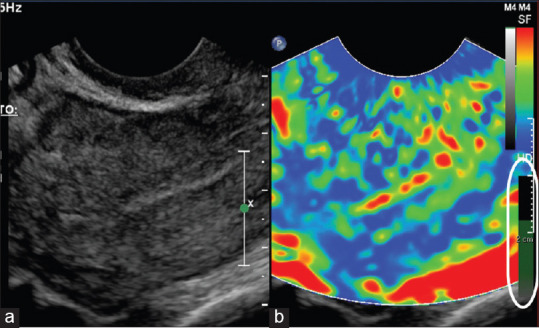
Duplex images of conventional ultrasound (a) and elastogram (b) taken from a normal control. The green bar (circled in white) shows the optimal level of compression achieved
The elastogram is a color-coded strain map that can be displayed together with the gray scale image. In our study, the gray scale images and elastographic images were displayed in a duplex format for the comparison of the endometrium. The elastography window covered the entire field of the ultrasound image on the sagittal plane to include the entire length of the endometrium for the comparison of thickness. The machine preset the color map with areas of softest consistency in red, intermediate consistency as yellow/green, and tissues with hardest texture as blue. A video clip of the elastography was recorded and processed for the strain and thickness ratios. Based on the elastogram, the strain ratio was obtained by measuring the strain of the myometrium over the strain of the stiffest region within the endometrium, at the same depth from the transducer [Figure 2]. From the strain ratio plot, three points along the steadiest acquisition were randomly selected and the average was the final recorded strain ratio. The thickness ratio was obtained from the ratio of the endometrial thickness measured on grayscale image over the thickness of the endometrium on the elastography map (color-coded in green, yellow or red to indicate softer texture) at the same corresponding sagittal plane [Figure 3a and b]. Myometrium was color coded in blue. All the elastographic measurements were performed by two readers (CLO and LEC).
Figure 2.
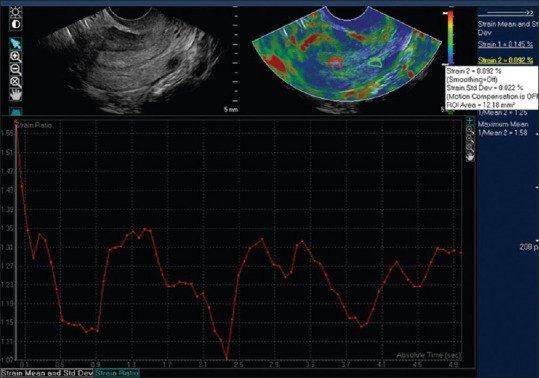
Images show regions where the strain measurements are obtained: Strain 1 was positioned on the endometrium and strain 2 was placed in the myometrium at the same depth from the transducer. The graph below the images show the strain ratio plot
Figure 3.

A 47-year-old with 2 months of menorrhagia. Histopathology showed 21% invasion by the endometrial carcinoma. The images demonstrate measurements of the endometrium on the grey scale and elastogram for the calculation of the distance ratio. (a) Gray scale ultrasound image showed endometrial thickness of 13.5 mm, some heterogeneity. (b) Sonoelastography showed reduced soft endometrial tissue thickness (within calipers) compared to gray scale measurement at 6.5 mm
Statistical analysis
The data were summarized under cases (patients with endometrial cancer) and controls (normal patients) using the mean (standard deviation) for the continuous variables and number (proportions) of patients for the categorical variables. For the comparisons between groups, Student's t-test or Fisher's exact test were used, as appropriate. The receiver operating characteristics (ROCs) curve was fitted, and the area under the ROC curve (AUC) with 95% confidence interval (CI) was used to determine the cutoff value to differentiate between normal and malignant endometrium. Significance level was set at 5%, and all tests were two-sided. IBM SPSS Statistics 19 software (IBM Corporation, Armonk, USA) was used for the analyses. The intraclass correlation coefficient was used to analyze the agreement between the two readers. For all analyses, P < 0.05 was considered to indicate statistical significance.
RESULTS
There were a total of 28 controls and 33 endometrial cancer patients (cases) recruited. Out of the 33 cases, four patients had no residual tumor in the histopathological results of their hysterectomy specimens and were excluded from the comparative analysis. Data from 28 controls and 29 cases were analyzed.
Demographic characteristics of the patients and controls are summarized in Table 1. There was no significant difference in mean age between controls and cases, but the mean body weight and body mass index (BMI) were statistically significantly higher in the cases (P = 0.002 and P < 0.001, respectively). There were almost equal numbers of premenopausal and postmenopausal cases, whereas there were more premenopausal women (64.3%) among the control group. We performed a comparison of strain ratios between pre- and postmenopausal women in both the case and control groups and found no significant difference [Table 2]. This corroborated with the findings in a study by Manchanda et al.[16] who used shear-wave elastography that also showed no significant difference in endometrial elasticity between pre- and postmenopausal normal women. In that study, they also found no difference in endometrial elasticity within the menstrual cycle of premenopausal women. In our comparison of the strain ratios between pre- and postmenopausal cases, we also did not find significant difference in the strain ratios of the malignant endometrium. The main clinical presentations among our cases were menorrhagia (n/%: 8/28%), metromenorrhagia (7/24%), and postmenopausal bleeding (14/48%).
Table 1.
Demographic characteristics for control and patients with endometrial cancer
| Variables | Control (n=28) | Case (n=29) | P of t-test |
|---|---|---|---|
| Age (years), mean (SD) | 44.8 (11.0) | 49.5 (8.8) | 0.077 |
| Weight (kg), mean (SD) | 61.2 (10.4) | 75.3 (20.5) | 0.002* |
| BMI (kg/m2), mean (SD) | 24.7 (3.9) | 30.5 (7.5) | <0.001* |
| Menopausal status, n (%) | 0.412 | ||
| Premenopause | 18 (64.3) | 15 (51.7) | |
| Postmenopause | 10 (35.7) | 14 (48.3) | |
| Presentation, n (%) | |||
| Menorrhagia | NA | 8 (27.6) | NA |
| Metromenorrhagia | NA | 7 (24.1) | NA |
| Postmenopausal bleeding | NA | 14 (48.3) | NA |
*P<0.05 as significant, t-test or Fisher’s exact test. SD: Standard deviation, BMI: Body mass index, NA: Not applicable
Table 2.
Comparison of strain ratios between pre- and post-menopausal women
| Premenopausal | n | Postmenopausal | n | P | |
|---|---|---|---|---|---|
| Controls | |||||
| Strain ratio, mean (SD) | 0.42 (0.14) | 18 | 0.54 (0.17) | 5 | 0.131 |
| Minimum-maximum | 0.20-0.70 | 0.32-0.68 | |||
| Cases | |||||
| Strain ratio, mean (SD) | 1.04 (0.65) | 14 | 1.09 (0.71) | 14 | 0.683 |
| Minimum-maximum | 0.13-2.34 | 0.14-2.96 |
SD: Standard deviation
Table 3 shows the summary of ultrasound imaging and elastographic characteristics. Strain ratio obtained by measuring the strain measurements of myometrium over that of the endometrium was significantly higher in cases (P < 0.001) indicating increased stiffness in endometrial cancer. Distance (thickness) ratio by measuring the ratio of endometrial thickness on gray scale over that obtained on elastography scale was significantly higher in the cases compared to controls (P = 0.006). Both parameters indicate that endometrium in cancer patients is stiffer than in the normal population. In three cases (two postmenopausal and one premenopausal), the elastographic image of the endometrium was totally replaced (color coded blue) and we defined the elastographic thickness in these patients as zero. In two cases, we were unable to obtain the elastographic image of the endometrium due to technical issues. In five controls (all postmenopausal women), the endometrium was too thin, and assessment of strain ratios could not be reliably obtained.
Table 3.
B-mode ultrasound imaging and elastographic characteristics for control and patients with endometrial cancer
| Variables | Control | n | Case | n | P of t-test |
|---|---|---|---|---|---|
| Strain ratio, mean (SD) | 0.45 (0.15) | 23 | 1.03 (0.67) | 28 | <0.001* |
| Endometrial thickness grey scale (mm), mean (SD) | 4.51 (2.69) | 28 | 12.1 (8.81) | 28 | <0.001* |
| ED, (mm), green scale, mean (SD) | 4.25 (3.18) | 28 | 6.25 (5.80) | 26 | 0.118 |
| Distance ratio, grey/green, mean (SD) | 0.93 (0.29) | 23 | 1.98 (1.70) | 23 | 0.006* |
1. When the endometrium was totally replaced by tumor, the elastographic thickness was defined as 0 in 3 cases (2 postmenopausal and 1 premenopausal). In these cases, the distance ratio of elastographic distance/gray scale thickness = 0, while the distance ratio of grey/elastographic distance is invalid, 2. There were also three cases (one premenopausal and two postmenopausal), where the distance ratio could not be obtained due to technical difficulty in measuring due to either the axial position of the uterus or the appearance of the elastographic image. SD: Standard deviation, ED: Elastography distance
Normal endometrium showed low to intermediate stiffness [Figure 4a and b] on elastography as depicted on the color scale in red, yellow, or green. In the presence of malignancy, there was reduction in the thickness of the normal color stripe and replacement by harder tissues [Figure 5a and b] which were color coded in blue.
Figure 4.
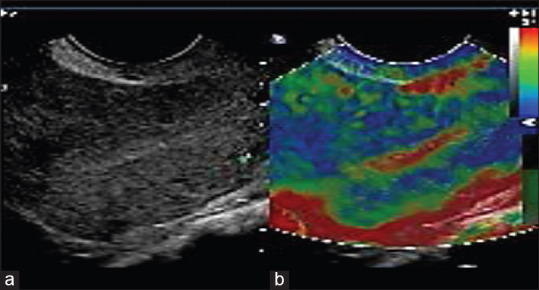
(a) Gray scale image of normal endometrium. (b) Elastography of normal endometrium color coded in red and green indicating softer tissues. Myometrium is shown predominantly in blue
Figure 5.
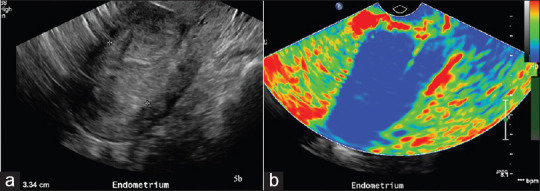
A 45-year-old with 88.3% invasion by endometrial carcinoma as shown on histopathology. (a) Gray scale ultrasound image showing markedly thickened endometrium measuring 33 mm. (b) Sonoelastography showing near complete replacement of endometrial stripe by “hard” tissues color-coded in blue
In the subgroup analysis based on menopausal status [Table 4], the results showed that both in pre- and postmenopausal cases, the strain ratio was statistically significantly higher in cases compared to controls (P < 0.001 and P = 0.016), whilst the distance ratio was significantly higher in cases (P ≤ 0.05) only among the postmenopausal cases, using the ratio of endometrial thickness measured on gray scale over that of elastography.
Table 4.
Demographic, B-mode ultrasound imaging, and elastographic characteristics for control and patients with endometrial cancer based on menopausal status
| Variables | Premenopause | Postmenopause | ||||||||
|---|---|---|---|---|---|---|---|---|---|---|
|
|
|
|||||||||
| Control | n | Case | n | P | Control | n | Case | n | P | |
| Age, mean (SD) | 38.3 (7.3) | 18 | 42.6 (4.3) | 15 | 0.052 | 56.3 (5.7) | 10 | 56.8 (5.8) | 14 | 0.730 |
| Minimum-maximum | 25-48 | 34-49 | 49-66 | 48-69 | ||||||
| Weight (kg), mean (SD) | 58.8 (9.5) | 18 | 79.5 (26.8) | 15 | 0.004* | 65.6 (10.9) | 10 | 70.7 (9.5) | 14 | 0.612 |
| BMI (kg/m2), mean (SD) | 23.7 (3.3) | 18 | 33.2 (9.7) | 15 | 0.001* | 26.7 (4.4) | 10 | 28.6 (3.6) | 14 | 0.208 |
| Strain ratio, mean (SD) | 0.42 (0.14) | 18 | 1.04 (0.65) | 14 | <0.001* | 0.54 (0.17) | 5 | 1.09 (0.71) | 14 | 0.016* |
| Endometrial thickness (mm), gray scale, mean (SD) | 5.69 (2.66) | 18 | 12.3 (9.03) | 14 | NA | 2.39 (0.74) | 10 | 11.9 (8.9) | 14 | 0.003* |
| Minimum–maximum (mm) | 2.6-12.5 | 3.6-32.7 | 1.3-3.8 | 2.4-30.6 | ||||||
| Elastography distance (mm), green scale, mean (SD) | 5.74 (2.89) | 18 | 6.39 (4.65) | 14 | 0.584 | 1.57 (1.47) | 10 | 6.07 (7.24) | 12 | 0.057 |
| Distance ratio, gray/green, mean (SD) | 0.99 (0.29) | 17 | 1.96 (2.12) | 13 | 0.073 | 0.75 (0.22) | 6 | 2.00 (1.03) | 10 | 0.012* |
When the endometrium was totally replaced by tumor, the elastographic distance was defined as 0. In these cases, the distance ratio of gray/green was invalid. NA: Not applicable in premenopausal women due to cyclical changes during the menstrual cycle, SD: Standard deviation, BMI: Body mass index
The results of analysis of correlation between elastographic features, endometrial thickness, histopathology, and depth of invasion in cases are shown in Table 5. We did not find significant correlation between elastographic features and other ultrasonographic features such as endometrial thickness and vascularity or histopathologic features. The majority of the cases in this study had histological Grade 1 disease (64%) and no invasion or <50% invasion (82%). As this study focused mainly on the local aspects of endometrial cancer in the uterus, we did not include information on nodal or distant disease required in staging of the disease.
Table 5.
The correlation coefficient between two variables in patients (cases)
| Variables | Endometrial thickness | Depth of invasion (%) | ||
|---|---|---|---|---|
|
|
|
|||
| Coefficient | P | Coefficient | P | |
| Strain ratio | 0.144 | 0.464 | 0.209 | 0.297 |
| Distance ratio (gray/green) | 0.557 | 0.005 | 0.594 | 0.003 |
| Depth of invasion (%) | 0.435 | 0.023 | 1 | - |
| Vascularity | 0.667 | <0.001 | 0.562 | 0.003 |
The inter-rater reliability test is showed in Table 6. The intraclass coefficients between the two raters of the appearance of the endometrial stripe on the elastography color map, measurability of the endometrial stripe on the elastography map, endometrial vascularity, the measurements of the endometrial strip on gray scale and elastography color map, and the distance ratio were all above 0.70, indicating good agreement between two raters.
Table 6.
The intraclass correlation coefficient between the two readers
| Variables | Control | Case | ||
|---|---|---|---|---|
|
|
|
|||
| Coefficient (95% CI) | P | Coefficient (95% CI) | P | |
| Endometrial stripe | 0.700 (0.343-0.859) | 0.001 | 0.719 (0.431-0.861) | P<0.001 |
| Measurability of elastographic distance | 0.822 (0.616-0.918) | <0.001 | 0.736 (0.466-0.870) | <0.001 |
| Vascularity of tumor | NA | NA | 0.843 (0.682-0.922) | <0.001 |
| Endometrial thickness | 0.910 (0.805-0.958) | <0.001 | 0.974 (0.947-0.987) | <0.001 |
| Elasto distance, green scale | 0.969 (0.933-0.986) | <0.001 | 0.965 (0.930-0.983) | <0.001 |
| Distance ratio, grey/green | 0.874 (0.730-0.942) | <0.001 | 0.947 (0.890-0.974) | <0.001 |
Data were represented as correlation coefficient (95% CI). Vascularity was not measured in control group. CI: Confidence interval, NA: Not applicable
The demographic, B-mode ultrasound imaging and elastographic characteristics for four patients without residual tumor are shown in Table 7.
Table 7.
Demographic, B-mode ultrasound imaging, and elastographic characteristics for patients without residual tumor
| Variables | n=4 |
|---|---|
| Age (years), mean (SD) | 48.5 (2.4) |
| Weight (kg), mean (SD) | 62.1 (15.0) |
| BMI (kg/m2), mean (SD) | 25.6 (6.1) |
| Endometrial thickness (mm), mean (SD) | 6.3 (4.7) |
| Strain ratio, mean (SD) | 0.34 (0.18) |
| Distance ratio, gray/green, mean (SD) | 1.01 (0.03) |
SD: Standard deviation, BMI: Body mass index
The ROC curve based elastography strain ratio is shown in Figure 6 where the overall AUC is 0.823, with 95% CI between 0.694 and 0.952. The ROC curve for elastographic thickness ratio shown in Figure 7 has an AUC of 0.884 with 95% CI ranging from 0.786 to 0.982. Using the ROC curve, the best cut-off value for elastography strain ratio, overall, was 0.62 with a sensitivity of 75% and specificity of 82.6% and for thickness ratio of gray scale/elastography, it was 1.15 with a sensitivity of 79.2% and specificity of 87% for all cases.
Figure 6.
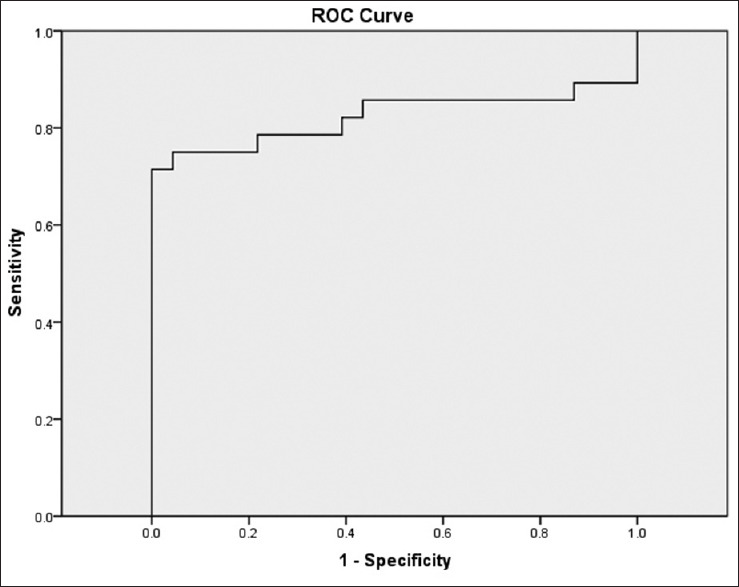
Receiver operating characteristic curve based on elastography strain ratio. AUC is 0.823 (95% confidence interval 0.694–0.952)
Figure 7.
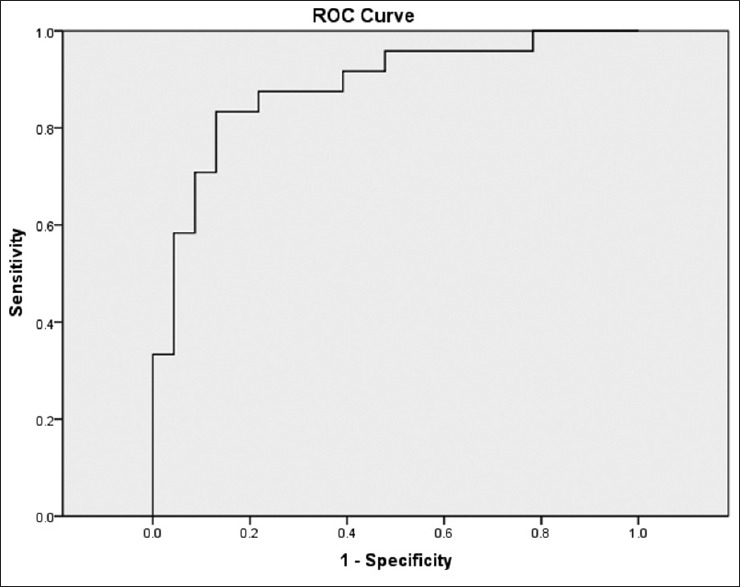
Receiver operating characteristic curve based on thickness ratio (gray scale thickness over elastographic thickness). AUC is 0.884 (95% confidence interval 0.786–0.982)
There were two patients with malignancies who had “soft” endometrial stripes on elastography. One of them had carcinosarcoma with large mucin pools, and the other had tumour confined to the cornual region.
DISCUSSION
The incidence of endometrial cancer is rising, particularly in developed countries. Although the majority of affected women are postmenopausal, between 5% and 30% of endometrial cancer were diagnosed in premenopausal women.[17] One of the risk factors identified among the premenopausal age group is obesity.[4,18] Moreover, this factor was observed even in our small cohort of premenopausal cases who were randomly recruited for the study. In contrast, there was no significant BMI difference between the controls and cases in the postmenopausal group.
Ultrasound plays an important role in the initial assessment of women presenting with abnormal uterine bleeding. Endometrial thickness measured on ultrasonography has been studied and used as a criterion to decide on whether to perform invasive testing in women presenting with postmenopausal bleeding.[19,20,21,22] On the other hand, there is no well-established criteria for endometrial thickness or any ultrasound features in premenopausal women whose risk and management depend on clinical features such as age, BMI, family history, and presentation of abnormal bleeding.[23]
Elastography has developed into a useful adjunct to ultrasound for evaluating tissue stiffness. It is well established in evaluating chronic liver disease and breast nodules. Studies in gynaecological ultrasound have shown potential utility in evaluating cervical cancers,[24] and distinguishing uterine leiomyomas from adenomyomas.[25]
This study shows that sonoelastography may be a useful adjunct to detect endometrial malignancy. An early study by Preis et al.[26] alluded to differences in elastographic properties of different endometrial pathologies. Subsequent studies using strain ratios found increased endometrial stiffness associated with endometrial malignancy when compared to benign endometrial pathology and hyperplasia.[27,28,29] Strain elastography is a semi-quantitative technique of measuring tissue stiffness. Strain resulting from the external compression is inversely related to tissue stiffness, with stiffer tissues showing less strain. In the present study, we also performed separate analyses on pre- and postmenopausal women.
An increase in strain ratio which compared the strain ratio of adjacent tissue (in this case, the myometrium) and the affected endometrium showed increased endometrial stiffness in cases. However, there are differences in the values of strain ratio in this study as well as among previous studies.[27,28,29] The ultrasound equipment used in the previous studies as well as our study was all different. There were also differences in technique, for example, both Latif et al.[27] and Metin et al.[28] performed manual compression during sonoelastography. Metin et al.'s technique of mild repetitive compression and decompression appears similar to our technique. In Che et al.'s study,[29] the authors did not describe the use of compression and elastographic images were generated by breathing movements and arterial pulsation. The differences in technique, use of manual compression, and equipment likely contributed to the differences in the values of strain ratio.
Therefore, the absolute values for strain ratios may not be applicable to different institutions. This limitation may be addressed through the use of shear-wave elastography that is able to provide more objective measurements of tissue stiffness.[14]
We have not included cases with endometrial hyperplasia without malignancy in the study. Both Metin et al. and Che et al.[28,29] did not find any significant difference in the elastographic characteristics between endometrial hyperplasia and benign endometrial abnormalities and normal endometrium. Latif et al.,[27] however, found significant difference in the strain ratio between atypical endometrial hyperplasia, a precancerous condition, and typical endometrial hyperplasia in their small study cohort.
Distance or size ratio is another technique described in sonoelastographic breast studies to distinguish malignant from benign lesions. Our technique differs from previous studies[9,30] using distance ratio where the lesion's elastographic size was measured against its gray scale size. The reason for this is that from preliminary observations, stiff lesions within the endometrium tended to approach the elasticity of the myometrium, i.e., blue. This resulted in reduction in contrast between the endometrium and the myometrium. Distance or thickness ratio in this study, therefore compared the thickness of the endometrium on gray scale and the elastographic stripe shown in red, yellow, or green. Soft endometrial tissues were depicted in various colors ranging from red, yellow, and green. In the presence of malignancy, the endometrium lost these colors and was gradually replaced by colors (blue) indicating increasing stiffness. The use of thickness ratio combined the observation of the endometrium on gray scale with that on the elastogram. Thickness ratio was increased in patients with endometrial malignancy compared to normal participants. This was due to increased endometrial thickness on conventional grayscale ultrasonography, combined with reduction in the thickness of the endometrium on elastography. In three patients (two postmenopausal and one premenopausal), there was complete obliteration of the endometrial stripe on elastography. For these cases, the thickness ratio was nonmeasurable. However, thickness ratio was found to be significantly different between controls and cases only in the postmenopausal group. This might be due to a higher proportion of tumor in the endometrium resulting in significant increased thickness of endometrium on grayscale imaging amongst postmenopausal cases, as shown in the subgroup analysis. The quality of the elastogram was dependant on the quality of the conventional gray scale image. Without optimal visualisation of the endometrium, it was not possible to study it on elastography, as shown by one of the cases.
The use of strain ratio and thickness ratio may be incorporated into studies of women with abnormal uterine bleeding, along with the standard conventional ultrasonographic assessment. Detection of increased stiffness or loss of the normal endometrial stripe on elastography may provide another indication of possible pathology.
The limitations of this study, apart from the small sample size, included false-negative results from tumor histology or tumor location, such as that shown in the case of carcinosarcoma with large mucin pools. In that case, there were other abnormal ultrasonographic features such as markedly thickened endometrium of 25 mm that helped in the detection. We did not evaluate whether heavy vaginal bleeding during the time of the scan would affect the elastographic findings. It is possible that presence of blood clots in the endometrial cavity may be a confounding factor in elastographic assessments. However, all our patients underwent full sonographic examination incorporating color Doppler before the performance of the elastography.
Lesions located mainly in the cornual regions of the uterus were less amenable for detection by the technique due to artefacts caused by its proximity to bowel. Although it was not quantified, the technique was more susceptible to interference from bowel gas and movements with obscuration of uterine anatomy and the structures under evaluation.
Sonoelastography may be a useful adjunct to conventional ultrasonography for the evaluation of endometrial pathology despite its limitations. There is currently a lack of uniformity in practice. The method has limitations that include selection bias of the areas for measurements, lack of standardisation in use of compressive pressures, and challenges in reproducibility. The use of shear wave elastography that does not rely on the use of external compression for measurements may potentially overcome some of the limitations. Visual assessment and objectively quantifying the changes in the endometrium using thickness ratio may help to expand the use of elastography in evaluating the endometrium. Additional studies with larger cohorts are required to further evaluate this observation.
CONCLUSION
Our study showed that endometrial cancer demonstrated increased stiffness compared to normal endometrium using strain elastography. This was observed in both pre- and postmenopausal cases. We could demonstrate significant difference in thickness ratio in postmenopausal cases using our technique described. Standardization of methodology is required for sonoelastography to be more widely applied in gynecological ultrasonography.
Financial support and sponsorship
Nil.
Conflicts of interest
Dr. Chiou Li Ong, an editorial board member at Journal of Medical Ultrasound, had no role in the peer review process of or decision to publish this article. The other authors declared no conflicts of interest in writing this paper.
REFERENCES
- 1.World Cancer Research Fund: Endometrial Cancer. How Diet, Nutrition and Physical Activity Affect Endometrial (womb) Cancer Risk: c2021. [Last accessed on 2021 Jan 24]. Available from: https://www.wcrf.org/dietandcancer/endometrial-cancer .
- 2.Singapore Cancer Registry annual Report 2018. National Registry of Diseases Office, Health Promotion Board. 2021 March 31; [Google Scholar]
- 3.Sorosky JI. Endometrial cancer. Obstet Gynecol. 2012;120:383–97. doi: 10.1097/AOG.0b013e3182605bf1. [DOI] [PubMed] [Google Scholar]
- 4.Raglan O, Kalliala I, Markozannes G, Cividini S, Gunter MJ, Nautiyal J, et al. Risk factors for endometrial cancer: An umbrella review of the literature. Int J Cancer. 2019;145:1719–30. doi: 10.1002/ijc.31961. [DOI] [PubMed] [Google Scholar]
- 5.Langer RD, Pierce JJ, O’Hanlan KA, Johnson SR, Espeland MA, Trabal JF, et al. Transvaginal ultrasonography compared with endometrial biopsy for the detection of endometrial disease.Postmenopausal Estrogen/Progestin Interventions Trial. N Engl J Med. 1997;337:1792–8. doi: 10.1056/NEJM199712183372502. [DOI] [PubMed] [Google Scholar]
- 6.Gull B, Carlsson S, Karlsson B, Ylöstalo P, Milsom I, Granberg S. Transvaginal ultrasonography of the endometrium in women with postmenopausal bleeding: Is it always necessary to perform an endometrial biopsy? Am J Obstet Gynecol. 2000;182:509–15. doi: 10.1067/mob.2000.103092. [DOI] [PubMed] [Google Scholar]
- 7.Epstein E, Fischerova D, Valentin L, Testa AC, Franchi D, Sladkevicius P, et al. Ultrasound characteristics of endometrial cancer as defined by International Endometrial Tumor Analysis (IETA) consensus nomenclature: Prospective multicentre study. Ultrasound Obstet Gynaecol. 2018;51:818–28. doi: 10.1002/uog.18909. [DOI] [PubMed] [Google Scholar]
- 8.Ferraioli G, Wong VW, Castera L, Berzigotti A, Sporea I, Dietrich CF, et al. Liver ultrasound elastography: An update to the world federation for ultrasound in medicine and biology guidelines and recommendations. Ultrasound Med Biol. 2018;44:2419–40. doi: 10.1016/j.ultrasmedbio.2018.07.008. [DOI] [PubMed] [Google Scholar]
- 9.Barr RG, Destounis S, Lackey LB, 2nd, Svensson WE, Balleyguier C, Smith C. Evaluation of breast lesions using sonographic elasticity imaging: A multicenter trial. J Ultrasound Med. 2012;31:281–7. doi: 10.7863/jum.2012.31.2.281. [DOI] [PubMed] [Google Scholar]
- 10.Cosgrove D, Piscaglia F, Bamber J, Bojunga J, Correas JM, Gilja OH, et al. EFSUMB guidelines and recommendations on the clinical use of ultrasound elastography. Part 2: Clinical applications. Ultraschall Med. 2013;34:238–53. doi: 10.1055/s-0033-1335375. [DOI] [PubMed] [Google Scholar]
- 11.Gennisson JL, Deffieux T, Fink M, Tanter M. Ultrasound elastography: Principles and techniques. Diagn Interv Imaging. 2013;94:487–95. doi: 10.1016/j.diii.2013.01.022. [DOI] [PubMed] [Google Scholar]
- 12.Dietrich CF, Săftoiu A, Jenssen C. Real time elastography endoscopic ultrasound (RTE-EUS), a comprehensive review. Eur J Radiol. 2014;83:405–14. doi: 10.1016/j.ejrad.2013.03.023. [DOI] [PubMed] [Google Scholar]
- 13.Bamber J, Cosgrove D, Dietrich CF, Fromageau J, Bojunga J, Calliada F, et al. EFSUMB guidelines and recommendations on the clinical use of ultrasound elastography. Part 1: Basic principles and technology. Ultraschall Med. 2013;34:169–84. doi: 10.1055/s-0033-1335205. [DOI] [PubMed] [Google Scholar]
- 14.Shiina T, Nightingale KR, Palmeri ML, Hall TJ, Bamber JC, Barr RG, et al. WFUMB guidelines and recommendations for clinical use of ultrasound elastography: Part 1: Basic principles and terminology. Ultrasound Med Biol. 2015;41:1126–47. doi: 10.1016/j.ultrasmedbio.2015.03.009. [DOI] [PubMed] [Google Scholar]
- 15.Stoelinga B, Hehenkamp WJ, Brölmann HA, Huirne JA. Real-time elastography for assessment of uterine disorders. Ultrasound Obstet Gynecol. 2014;43:218–26. doi: 10.1002/uog.12519. [DOI] [PubMed] [Google Scholar]
- 16.Manchanda S, Vora Z, Sharma R, Hari S, Das CJ, Kumar S, et al. Quantitative sonoelastographic assessment of the normal uterus using shear wave elastography: An initial experience. J Ultrasound Med. 2019;38:3183–9. doi: 10.1002/jum.15019. [DOI] [PubMed] [Google Scholar]
- 17.Soliman PT, Oh JC, Schmeler KM, Sun CC, Slomovitz BM, Gershenson DM, et al. Risk factors for young premenopausal women with endometrial cancer. Obstet Gynecol. 2005;105:575–80. doi: 10.1097/01.AOG.0000154151.14516.f7. [DOI] [PubMed] [Google Scholar]
- 18.Moore K, Brewer MA. Endometrial cancer: Is this a new disease? Am Soc Clin Oncol Educ Book. 2017:435–42. doi: 10.1200/EDBK_175666. [DOI] [PubMed] [Google Scholar]
- 19.Timmermans A, Opmeer BC, Khan KS, Bachmann LM, Epstein E, Clark TJ, et al. Endometrial thickness measurement for detecting endometrial cancer in women with postmenopausal bleeding: A systematic review and meta-analysis. Obstet Gynecol. 2010;116:160–7. doi: 10.1097/AOG.0b013e3181e3e7e8. [DOI] [PubMed] [Google Scholar]
- 20.Tabor A, Watt HC, Wald NJ. Endometrial thickness as a test for endometrial cancer in women with postmenopausal vaginal bleeding. Obstet Gynecol. 2002;99:663–70. doi: 10.1016/s0029-7844(01)01771-9. [DOI] [PubMed] [Google Scholar]
- 21.Gupta JK, Chien PF, Voit D, Clark TJ, Khan KS. Ultrasonographic endometrial thickness for diagnosing endometrial pathology in women with postmenopausal bleeding: A meta-analysis. Acta Obstet Gynecol Scand. 2002;81:799–816. doi: 10.1034/j.1600-0412.2001.810902.x. [DOI] [PubMed] [Google Scholar]
- 22.Smith-Bindman R, Kerlikowske K, Feldstein VA, Subak L, Scheidler J, Segal M, et al. Endovaginal ultrasound to exclude endometrial cancer and other endometrial abnormalities. JAMA. 1998;280:1510–7. doi: 10.1001/jama.280.17.1510. [DOI] [PubMed] [Google Scholar]
- 23.Pennant ME, Mehta R, Moody P, Hackett G, Prentice A, Sharp SJ, et al. Premenopausal abnormal uterine bleeding and risk of endometrial cancer. BJOG. 2017;124:404–11. doi: 10.1111/1471-0528.14385. [DOI] [PMC free article] [PubMed] [Google Scholar]
- 24.Lu R, Xiao Y, Liu M, Shi D. Ultrasound elastography in the differential diagnosis of benign and malignant cervical lesions. J Ultrasound Med. 2014;33:667–71. doi: 10.7863/ultra.33.4.667. [DOI] [PubMed] [Google Scholar]
- 25.Stoelinga B, Hehenkamp WJ, Nieuwenhuis LL, Conijn MM, van Waesberghe JH, Brölmann HA, et al. Accuracy and reproducibility of sonoelastography for the assessment of fibroids and adenomyosis, with magnetic resonance imaging as reference standard. Ultrasound Med Biol. 2018;44:1654–63. doi: 10.1016/j.ultrasmedbio.2018.03.027. [DOI] [PubMed] [Google Scholar]
- 26.Preis K, Zielinska K, Swiatkowska-Freund M, Wydra D, Kobierski J. The role of elastography in the differential diagnosis of endometrial pathologies – Preliminary report. Ginekol Pol. 2011;82:494–7. [PubMed] [Google Scholar]
- 27.Latif MA, Shady M, Nabil H, Mesbah Y. Transvaginal sonoelastography in the differentiation of endometrial hyperplasia and endometrial carcinoma. Egypt J Radiol Nucl Med. 2016;47:1123–31. [Google Scholar]
- 28.Metin MR, Aydın H, Ünal Ö, Akçay Y, Duymuş M, Türkyılmaz E, et al. Differentiation between endometrial carcinoma and atypical endometrial hyperplasia with transvaginal sonographic elastography. Diagn Interv Imaging. 2016;97:425–31. doi: 10.1016/j.diii.2015.11.007. [DOI] [PubMed] [Google Scholar]
- 29.Che D, Wei H, Yang Z, Zhang Y, Ma S, Zhou X. Application of transvaginal sonographic elastography to distinguish endometrial cancer from benign masses. Am J Transl Res. 2019;11:1049–57. [PMC free article] [PubMed] [Google Scholar]
- 30.Garra BS, Cespedes EI, Ophir J, Spratt SR, Zuurbier RA, Magnant CM, et al. Elastography of breast lesions: Initial clinical results. Radiology. 1997;202:79–86. doi: 10.1148/radiology.202.1.8988195. [DOI] [PubMed] [Google Scholar]


