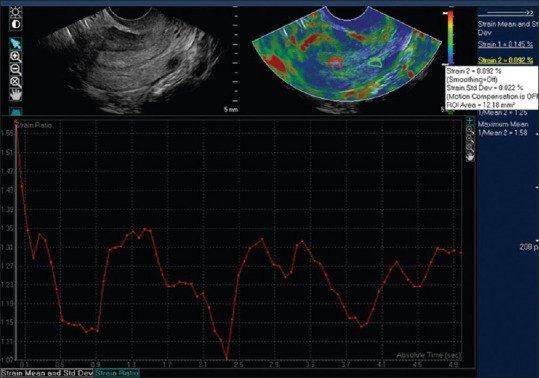
Figure 2.

Images show regions where the strain measurements are obtained: Strain 1 was positioned on the endometrium and strain 2 was placed in the myometrium at the same depth from the transducer. The graph below the images show the strain ratio plot
