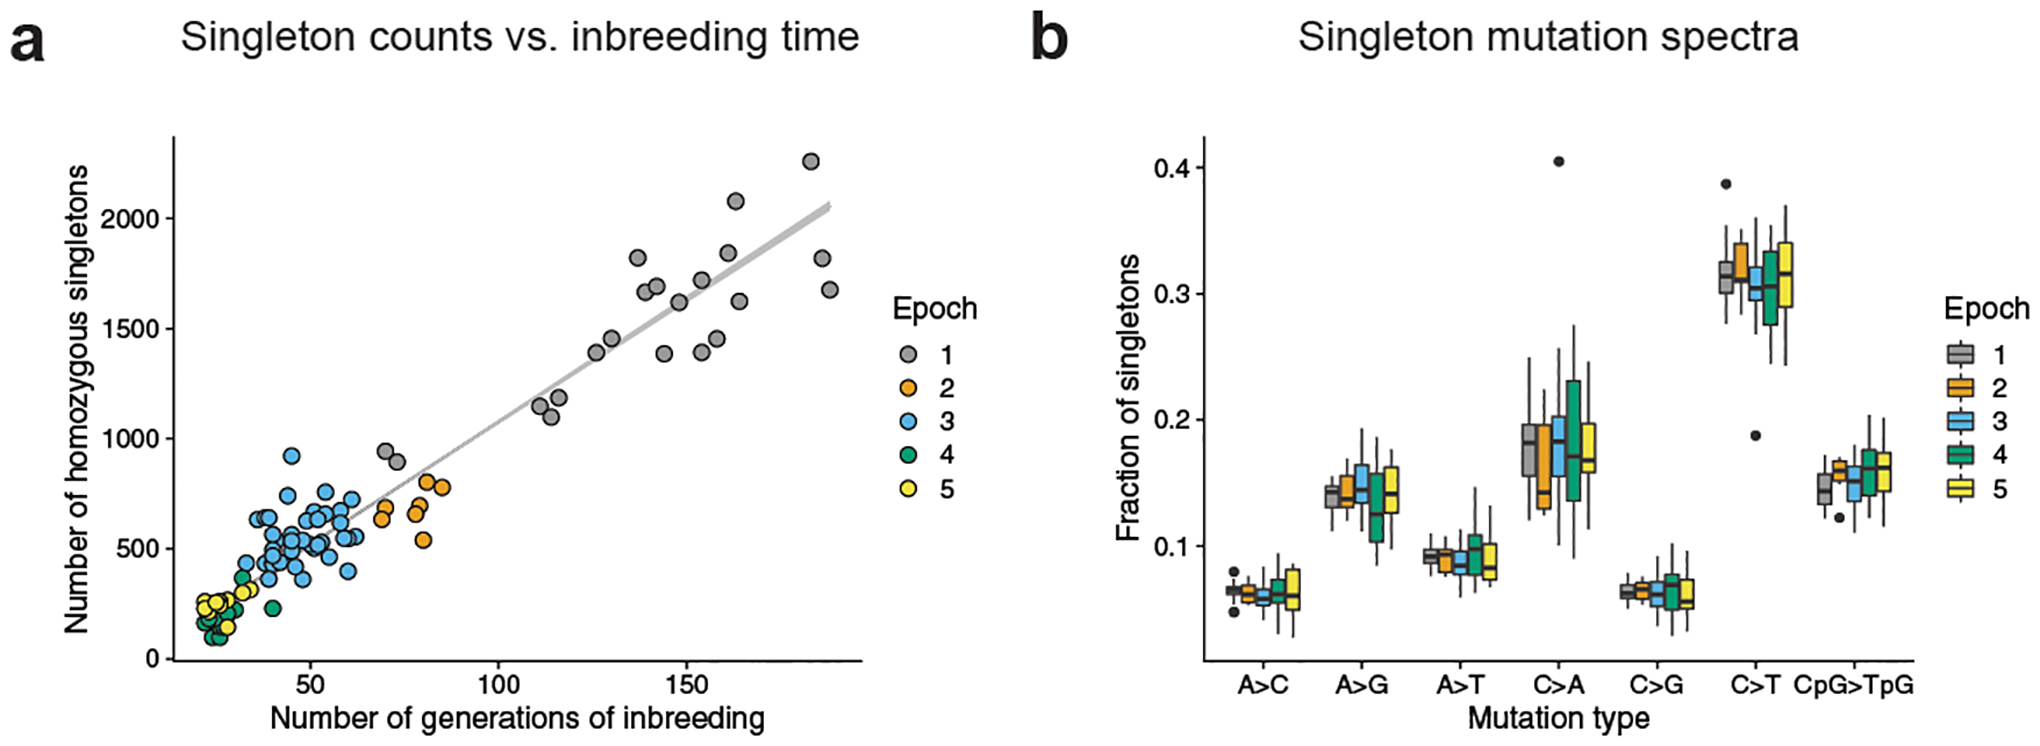
Fig. 1 |. Accumulation of homozygous singletons over many generations of laboratory inbreeding.

a, Counts of autosomal homozygous singletons (n = 63,914 unique mutations) in 94 BXDs correlate with the number of generations of inbreeding. Lower-numbered epochs are older and have been inbred for more generations. Line is from a Poisson regression (identity link) with 95% confidence bands. b, Fractions of singletons (n = 63,914 unique mutations) from each epoch that belong to each of seven mutation types across BXDs (n = 94 biologically independent mice), including the six possible transitions and transversions as well as CpG>TpG. Strand complements are collapsed (for example, C>T and G>A are considered to be the same mutation type). In box plots, the centre line is the median of each distribution, with bottom and top hinges corresponding to the 25th and 75th percentiles (that is, first and third quartiles), and whiskers extending to no further than 1.5 times the interquartile range from either hinge; data points outside of the range defined by the whiskers are displayed as individual points. The strain with an extremely high fraction of C>A singletons is BXD68.
