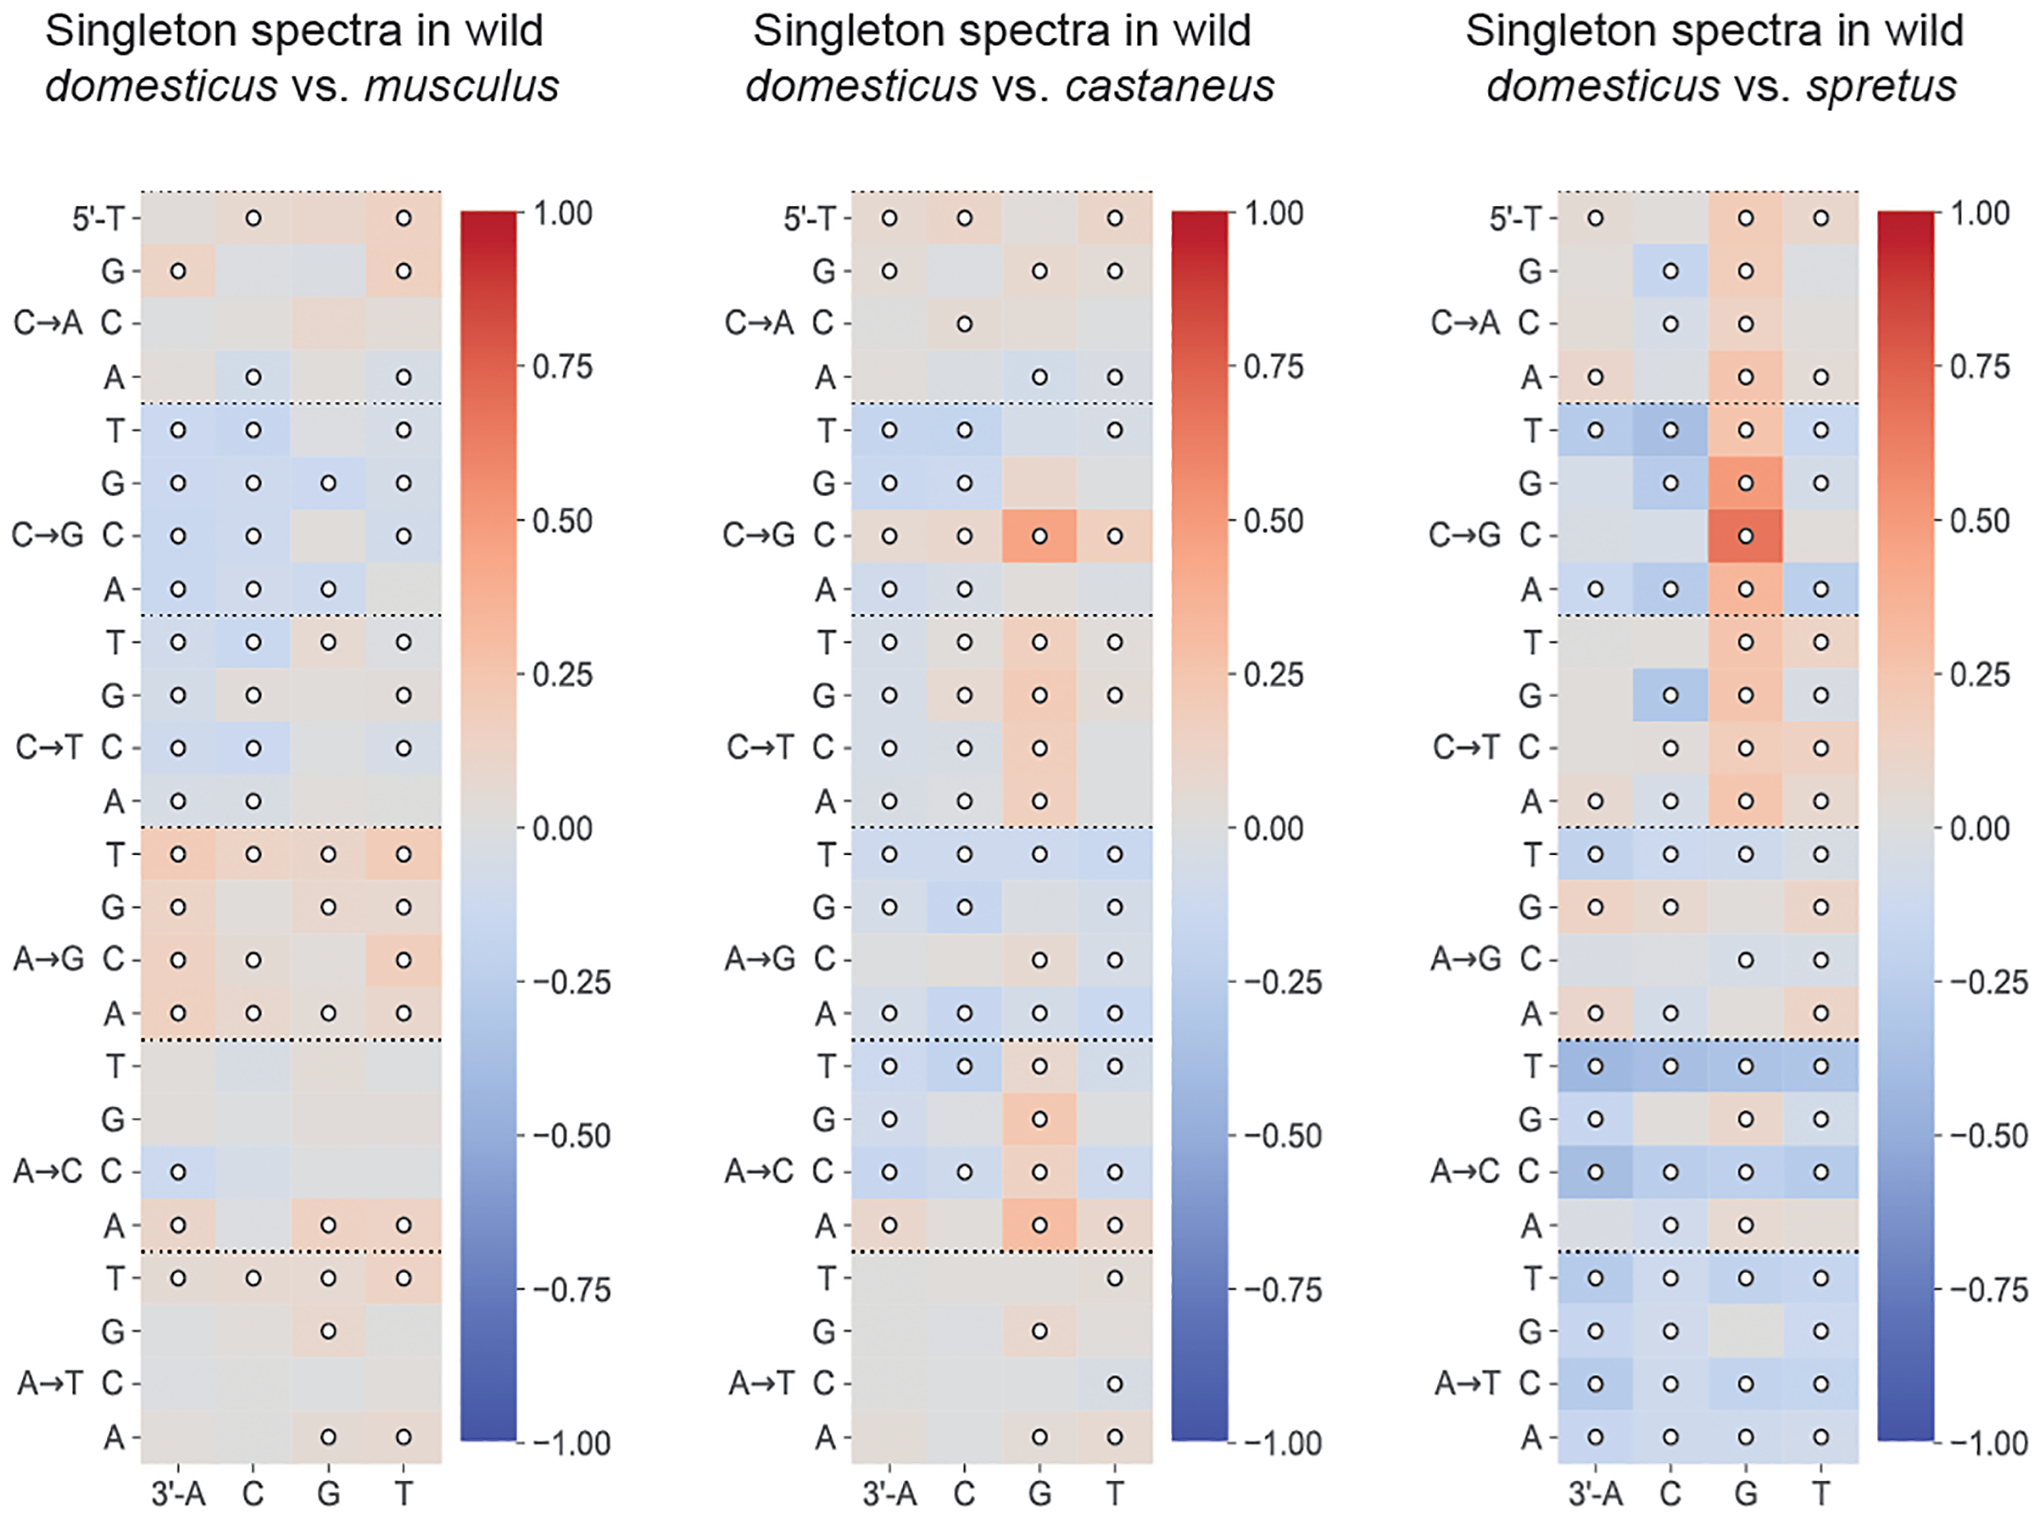
Extended Data Fig. 7 |. Comparisons of singleton spectra between wild M.m.domesticus and other wild species.

Log-2 ratios of singleton fractions of each 3-mer mutation type in Mus musculus domesticus, compared to three other wild subspecies or species of Mus. Comparisons with Chi-square test of independence p-values < 0.05/96 are annotated with white circles.
