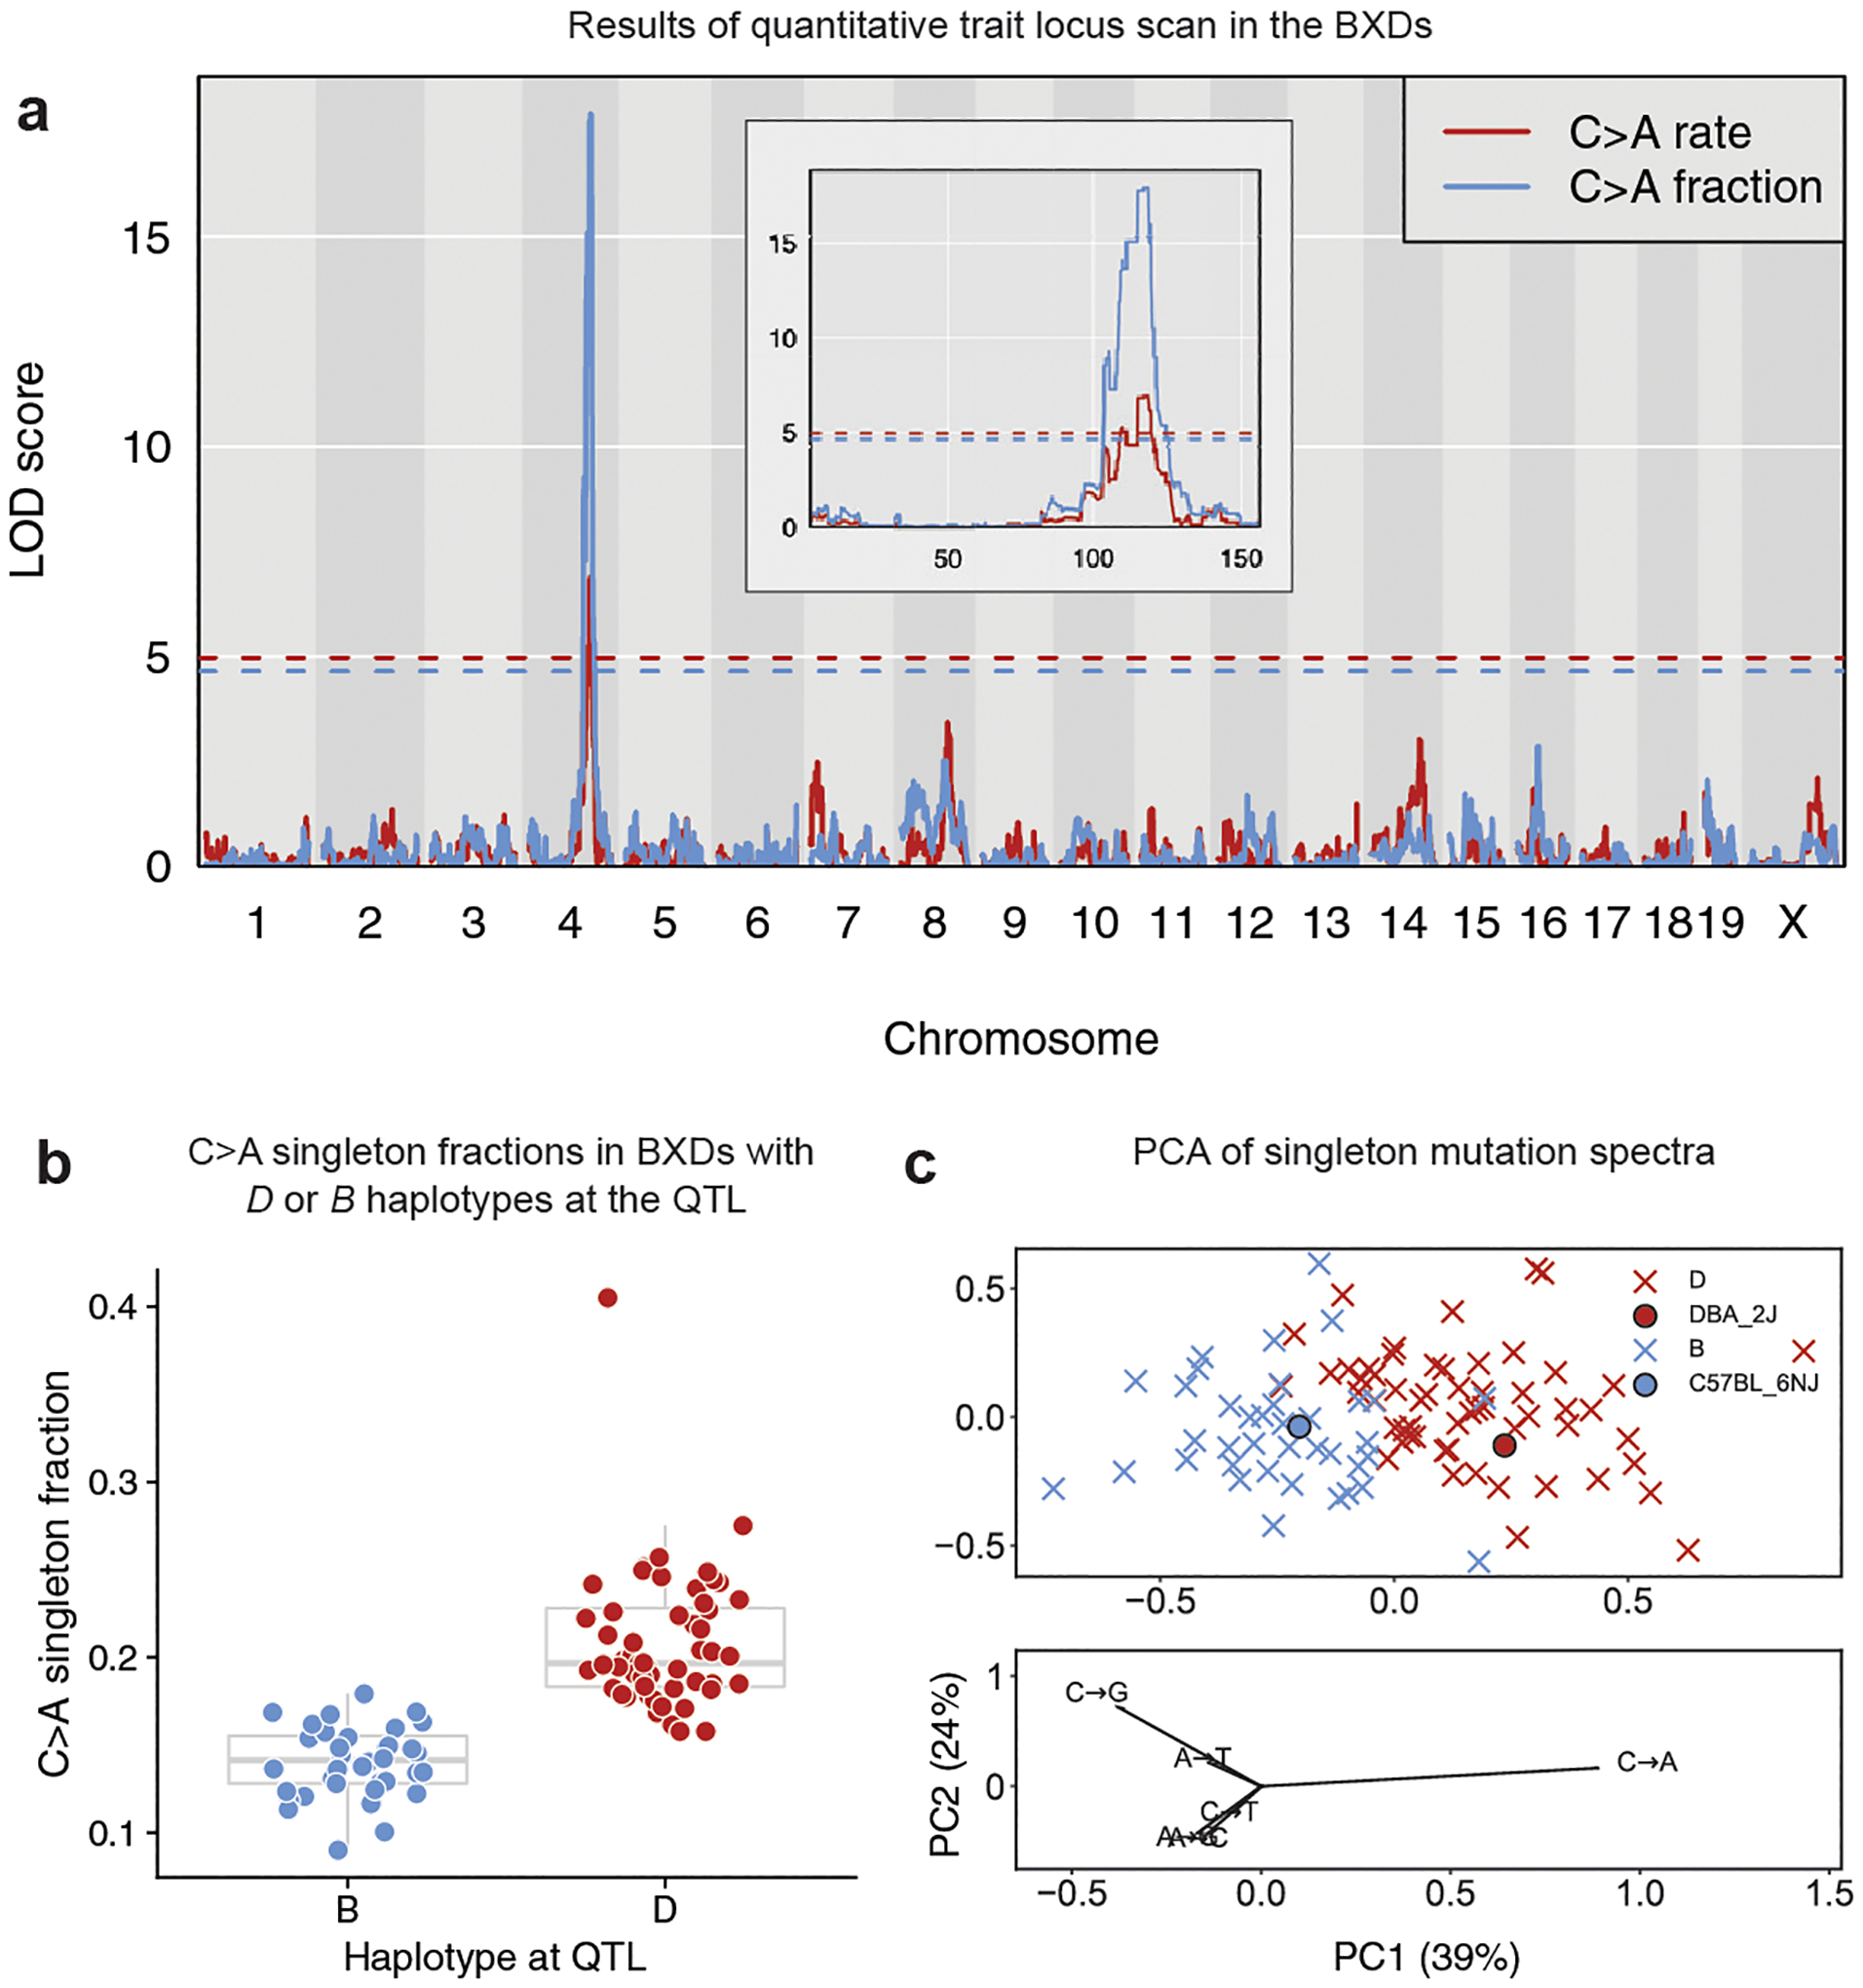
Fig. 2 |. A QTL on chromosome 4 for the germline C>A mutation rate.

a, LOD scores for the centred log-ratio transformed fraction (blue) and estimated rate (red) of C>A mutations. Blue and red dashed lines indicate genome-wide significance thresholds (using 1,000 permutations and a Bonferroni-corrected α = 0.05/15) for the fraction and rate scans, respectively. C>A fraction and rate phenotypes are included in the GeneNetwork database as BXD_24430 and BXD_24437, respectively. The inset shows a zoomed view showing LOD scores on chromosome 4 only. b, Fraction of C>A singletons in BXD lines homozygous for the D (n = 56 biologically independent mice) or B (n = 38 biologically independent mice) haplotype at the QTL on chromosome 4. In box plots, the centre line is the median of each distribution, with bottom and top hinges corresponding to the 25th and 75th percentiles (that is, first and third quartiles), and whiskers extending to no further than 1.5 times the interquartile range from either hinge. C>A fraction outlier BXD68 was not included in the QTL scan. c, Principal component analysis of the six-dimensional mutation spectra of BXD singletons (n = 63,914 mutations). BXDs are denoted as crosses coloured by parental ancestry at the QTL on chromosome 4 (D (red) or B (blue)). Strain-private mutation spectra for DBA/2J and C57BL/6NJ17 are denoted with circles. Loadings are plotted for each mutation type below. Fractions of each mutation type were centred log ratio transformed prior to principal component analysis.
